Risky assets have been on a sticky wicket since the Federal Reserve hiked rates by 75 basis points for the third time in a row on September 21. While the rate hike in itself was not a surprise, the Fed dot plots projecting a possible Fed funds rate of up to 4.4% by the end of 2022 was more aggressive than what investors had penciled in.
This started a sell-off in the United States equities markets which has pulled the Dow Jones Industrial Average into bear market territory and the S&P 500 to its lowest weekly close in 2022. The equities markets seem to be pricing in a recession due to the aggressive rate hikes by the Fed.
The Fed’s actions have resulted in a massive bull run for the US dollar index (DXY), which is not showing any signs of slowing down. That has already sent the euro to below parity with the dollar and the British pound is also threatening to follow suit. Aggressive tax cuts by the new government led by Prime Minister Liz Truss and reluctance to raise rates by the Bank of England sent the pound tumbling to an all-time low below 1.04 against the dollar on September 26.
In spite of the currency crisis and a sharp decline in the US equities markets, Bitcoin and several major cryptocurrencies have held up relatively well and have not retested their June lows. This is the first sign that the crypto space may be decoupling from the US equities markets.
However, these are early days yet because if the macroeconomic crisis deepens further and the stock markets enter a tailspin, then it is unlikely that the crypto markets will remain unscathed. Even at the risk of some downside risk, traders should use the current weakness in cryptocurrencies to build a portfolio for the long term. Instead of buying everything at once, traders may buy in batches, which will help reduce the risk.
What are the important support levels to watch out for on the downside? Read our analysis of the major cryptocurrencies to find out.
BTC/USD Market Analysis
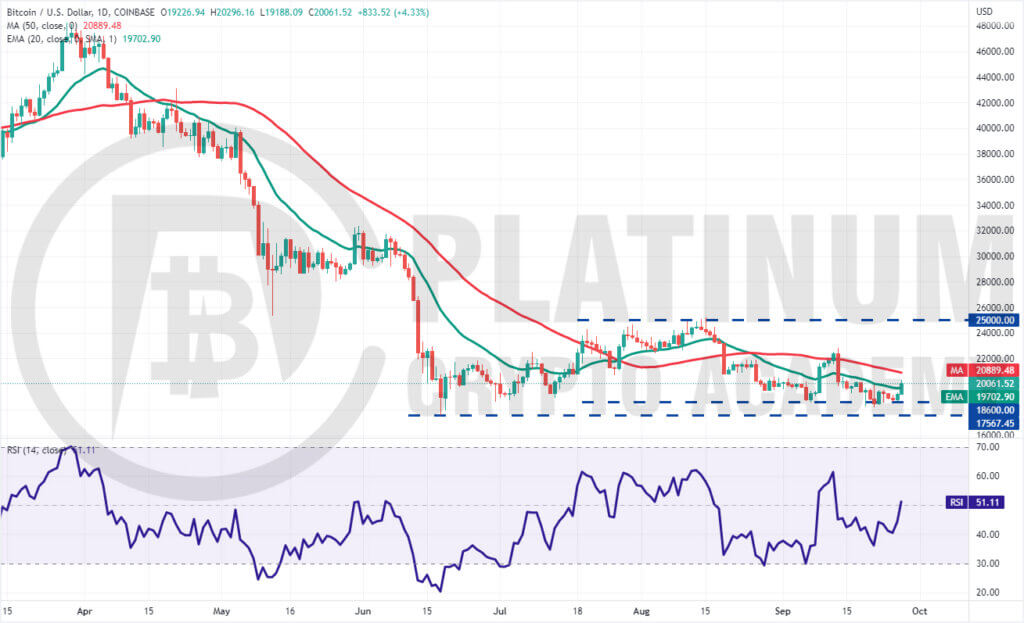
We said in our previous analysis that Bitcoin could retest the $18,600 to $17,567.45 support zone but the bulls will defend it aggressively and that is what happened.
The BTC/USD pair dropped and closed below the immediate support of $18,600 on September 21 but the bears could not build upon this advantage. Buyers quickly pushed the price back above $18,600 on September 22. This shows strong buying at lower levels.
The bulls again held the support on September 25 and started a rebound on September 26. The pair picked up momentum on September 27 and has risen above the 20-day exponential moving average (EMA). This is the first sign that the bears may be losing their grip. The pair could next rise to the 50-day simple moving average (SMA).
The zone between the 50-day SMA and $22,800 is likely to pose a strong challenge for the bulls. If the price turns down from this zone, the pair could stay range-bound between $18,000 and $22,800 for a few days.
Conversely, if bulls thrust the price above $22,800, the pair could pick up momentum and rally to the overhead resistance of $25,000. This positive view could invalidate if the price plummets below $17,567.
ETH/USD Market Analysis
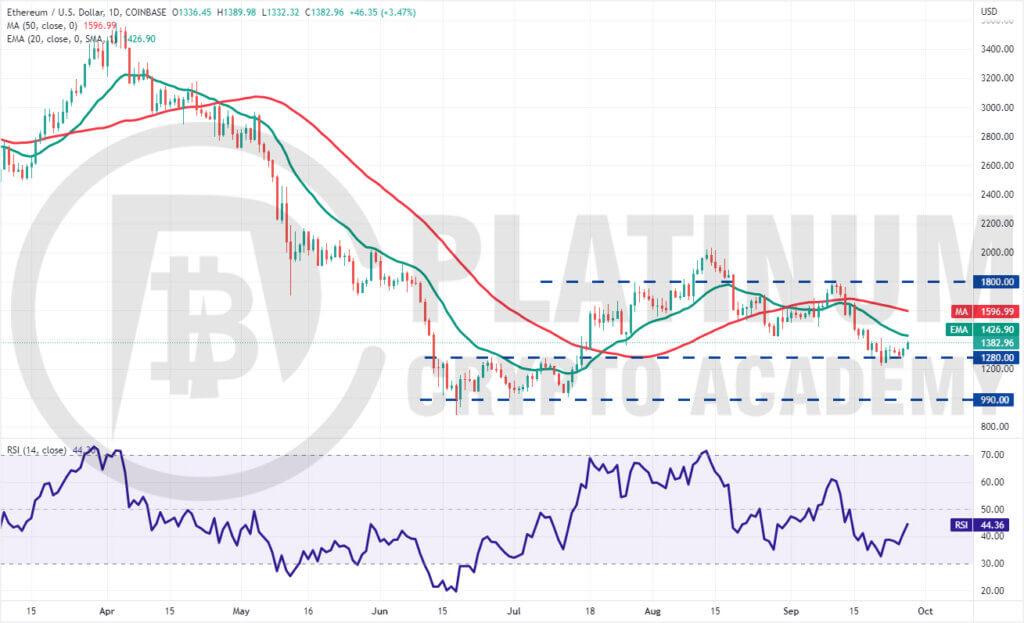
Ether dropped below the $1,280 support on September 21 but the bears could not sustain the lower levels. The bulls purchased the dip aggressively and pushed the price back above $1,280 on September 22.
The bulls thwarted one more attempt by the bears to sink the price below $1,280 on September 25. This started a strong recovery which has pushed the ETH/USD pair to the 20-day EMA.
If bulls drive the price above the 20-day EMA, the pair could rise toward the 50-day SMA. A break above this level will increase the probability that $1,280 is the new floor. The pair could then rally to $1,800.
Contrary to this assumption, if the price turns down sharply from the 20-day EMA, it will suggest that the sentiment remains negative and traders are selling on rallies. The bears will then make one more attempt to sink and sustain the price below $1,280. If they succeed, the pair could extend its decline to the psychological level of $1,000.
BNB/USD Market Analysis
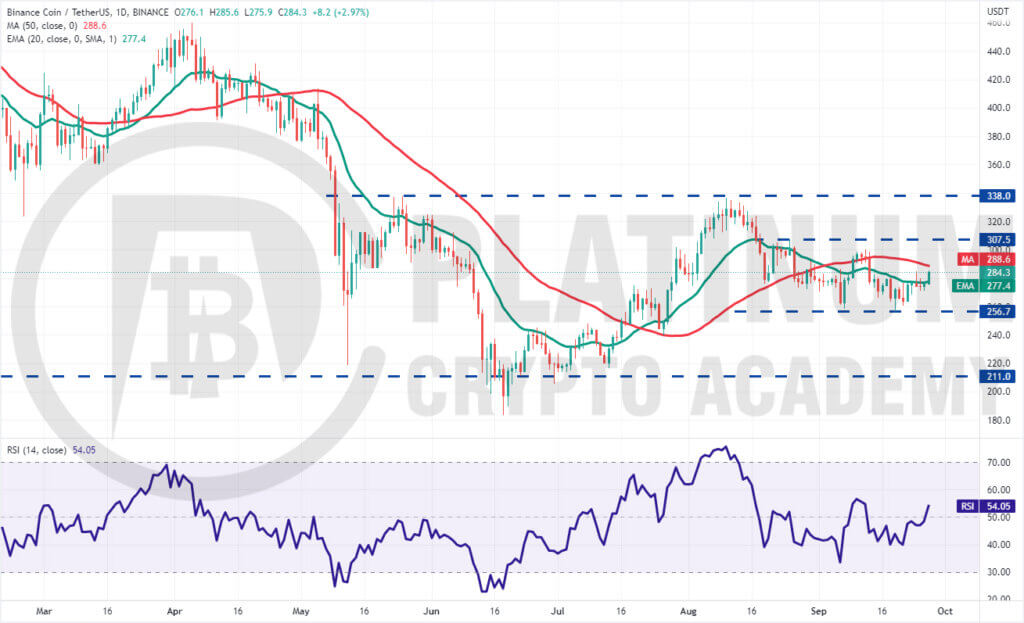
The bears tried to sink Binance Coin below the strong support at $256.70 on September 19 but the long tail on the day’s candlestick shows strong buying at lower levels. Although the bears continued to defend the 20-day EMA, they could not pull the price below $256.70.
The 20-day EMA has flattened out and the relative strength index (RSI) has jumped into positive territory indicating that bulls are attempting a comeback. Buyers have pushed the price above the 20-day EMA on September 27 and will challenge the 50-day SMA.
If bulls overcome this obstacle, the BNB/USD pair could rally to the overhead resistance of $307.50. This is an important level to keep an eye on because a break above it could propel the pair to $338. A break above this resistance will signal a potential trend change.
On the downside, $256.70 has proven to be a new floor. A breach of this support could intensify selling and pave the way for a decline to $240 and then to the crucial support of $211.
XRP/USD Market Analysis
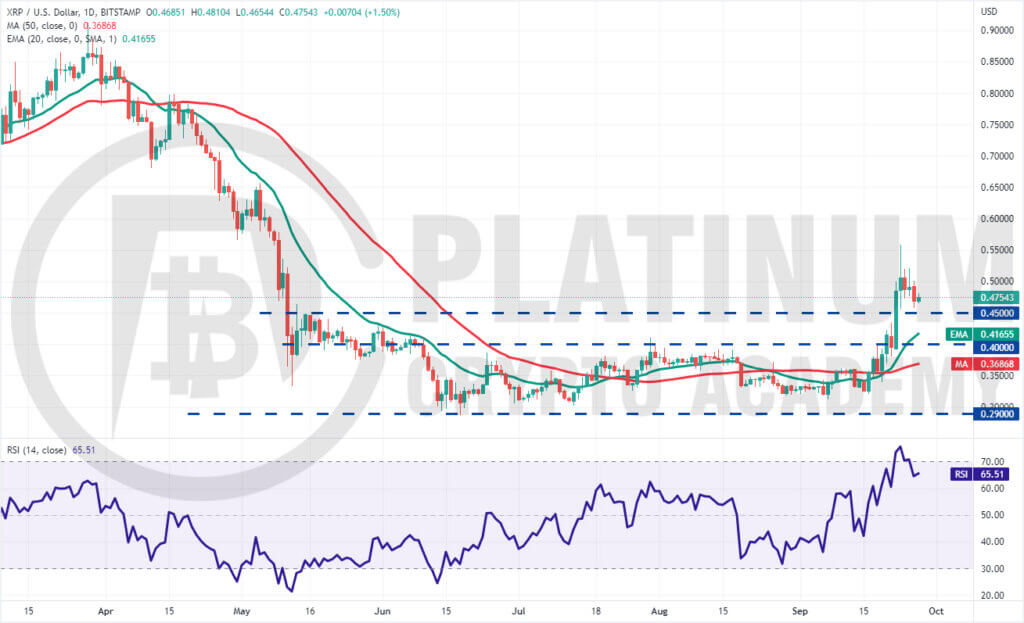
We stated in our previous analysis that if the price remains stuck between the moving averages and $0.40, the possibility of a break above the range will increase and that is what happened on September 20.
We had also projected a rally to $0.51 which was met on September 23 but the next target of $0.65 could not be achieved as the XRP/USD pair turned down from $0.56.
The sharp rally pushed the RSI into the overbought zone and may have tempted short-term traders to book profits. If bulls do not allow the price to break below $0.45, the likelihood of the continuation of the up-move increases. The pair could then rally to $0.65.
To invalidate this positive view, the bears will have to sink the price below the breakout level of $0.40.
ADA/USD Market Analysis
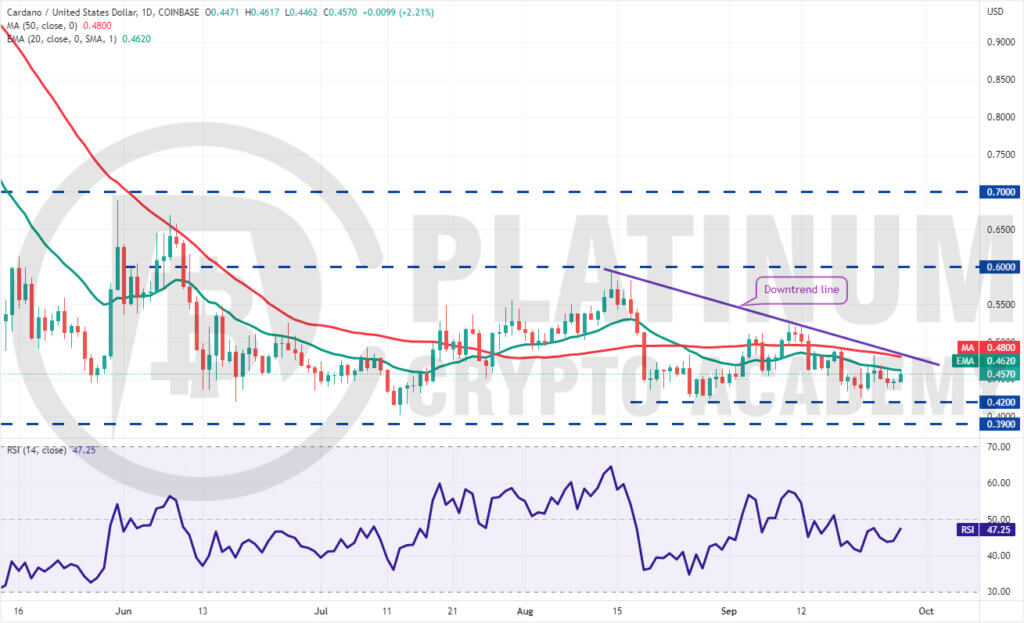
Cardano dropped to the immediate support of $0.42 on September 21 but the bulls defended the level successfully. That started a rebound on September 22 which turned down from the 50-day SMA on September 23.
The price action of the past few days has formed a descending triangle pattern, which will complete on a break and close below $0.42. If that happens, the ADA/USD pair could drop to $0.39 and if this level also cracks, the pair could plummet to $0.33.
On the other hand, if bulls push the price above the downtrend line, it will invalidate the bearish setup. That could open the door for a possible rise to $0.52. This level may again act as a stiff resistance but if bulls overcome this barrier, the pair could attempt a rally to $0.60.
.
Hopefully, you have enjoyed today’s article for further coverage please check out our crypto Blog Page. Thanks for reading! Have a fantastic day! Live from the Platinum Crypto Trading Floor.
Earnings Disclaimer: The information you’ll find in this article is for educational purpose only. We make no promise or guarantee of income or earnings. You have to do some work, use your best judgement and perform due diligence before using the information in this article. Your success is still up to you. Nothing in this article is intended to be professional, legal, financial and/or accounting advice. Always seek competent advice from professionals in these matters. If you break the city or other local laws, we will not be held liable for any damages you incur.


