Bitcoin rose marginally last week, snapping its longest streak of nine negative weekly closes. Bitcoin Price Prediction says the bulls attempted to build upon this strength in the new week and put in a bottom but the bears are in no mood to let go of their advantage.
Although Bitcoin has remained under pressure in 2022, institutional investors have continued to accumulate the dips. This suggests they remain bullish in the long term. CoinShares’ latest Digital Asset Fund Flows Weekly Report shows that year-to-date, the total institutional inflows into Bitcoin have crossed the half a billion-dollar mark.
In another sign that institutional investors have used the dips to buy, data from Arcane Research shows that Bitcoin exchange-traded products (ETPs) have 205,000 Bitcoin under management, which is a new record. While 9,765 Bitcoin was added in May, the pace picked up in June which has already seen more than 7,000 Bitcoin flow into the ETPs.
Does the sustained demand from institutional investors suggest that Bitcoin may have bottomed out or the downside is limited? According to Arthur Hayes, former CEO of BitMEX, Bitcoin’s previous halving cycles suggest that Bitcoin may bottom out in the range of $25,000 to $27,000 and Ether may find a bottom between $1,700 and $1,800.
Some analysts differ in their opinion and believe that Bitcoin price may see lower levels. Josh Olszewicz, head of research at Valkyrie Investments, said: “Uncertainty in the global economy due to high inflation and the likelihood we are in a recession, paired with the prevalence of central bankers raising rates, is likely going to force all assets downward at least through the end of the summer,” CNBC reported. He anticipates Bitcoin to dip to $22,000.
What should retail investors do? Join the institutional investors in accumulating gradually or wait for lower levels? Read our this week’s bitcoin price prediction & analysis to find out.
BTC/USD Market Analysis
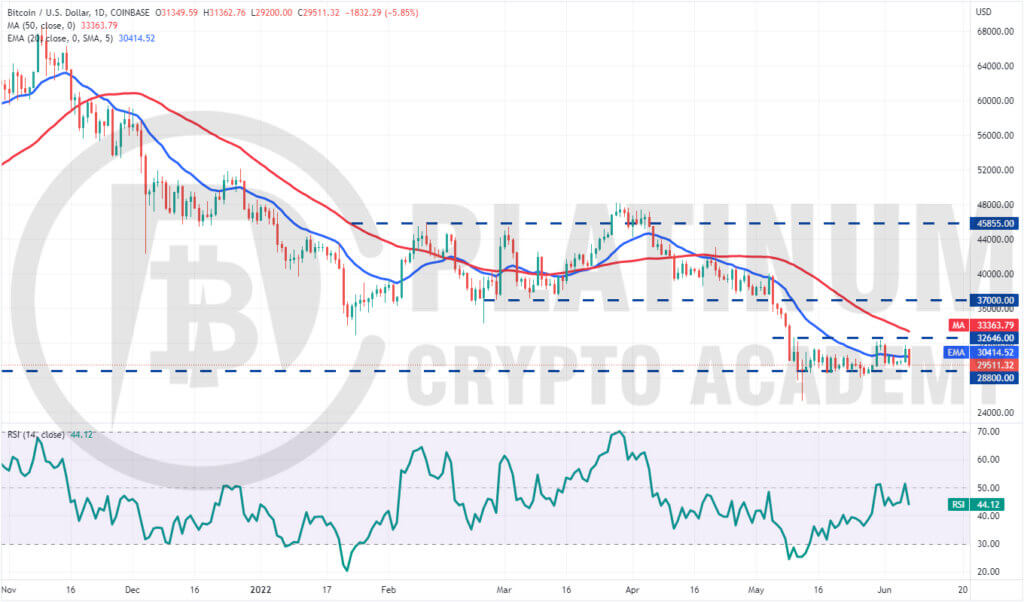
We had suggested in our previous analysis that Bitcoin may remain stuck in a range in the short term and that is how it has been. The BTC/USD pair has been trading between $28,800 and $32,646 for the past few days.
The bulls tried to propel the price above $32,646 on May 31 but the bears held their ground. That may have attracted profit-booking by short-term traders, which pulled the price back below the 20-day exponential moving average (EMA) on June 1.
Buyers again pushed the price above the 20-day EMA on June 6 but could not sustain the higher levels. This suggests that the sentiment remains negative and traders are selling on minor rallies.
The bears will now attempt to sink the price below the strong support of $28,800. If they manage to do that, the pair could drop to the May 12 intraday low of $25,338.
This is an important level for the bulls to defend because if it cracks, the selling may accelerate and the pair could plunge to $20,000.
The first sign of strength will be a break and close above $32,646. Such a move will increase the likelihood that a bottom may be in place. The pair could then attempt a rally to $37,000.
On the downside, $28,000 is the key level for the bears to defend. A breach of this support could open the doors for a decline to $25,000.
On the downside, $28,000 is the key level for the bears to defend. A breach of this support could open the doors for a decline to $25,000.
ETH/USD Market Analysis
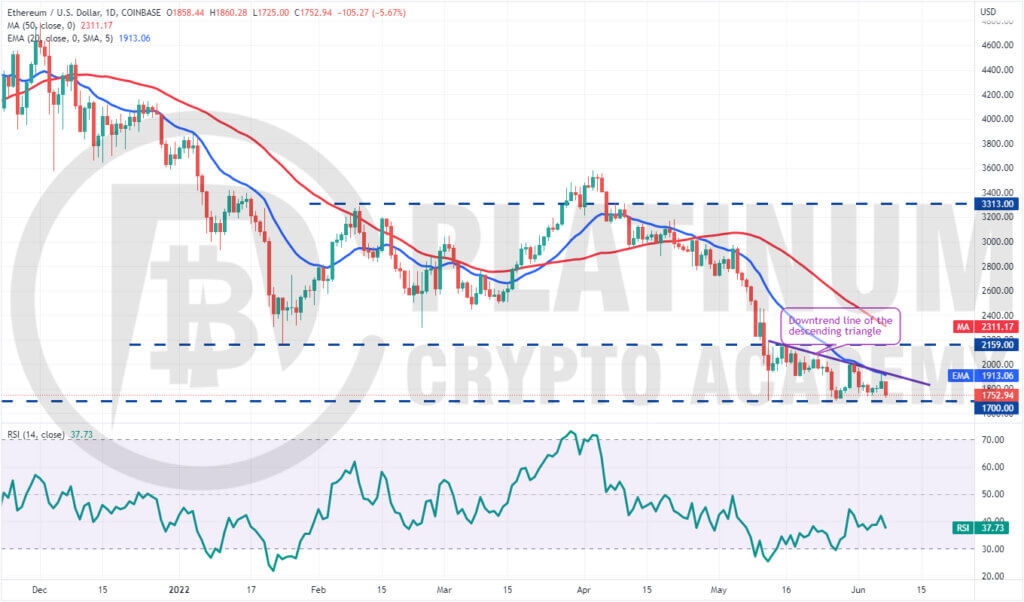
Ether turned down from the 20-day EMA on May 31 and again on June 7, indicating that the bears continue to defend the level aggressively.
The price action of the past few days has formed a descending triangle pattern, which will complete on a break and close below $1,700. If that happens, the ETH/USD pair could resume its downtrend.
The first support on the downside is $1,500 and if this level cracks, the next stop could be the pattern target of $1,241.
Alternatively, if the price rebounds off $1,700, it will suggest that the bulls are accumulating on dips to this level. The buyers will have to push and sustain the price above the downtrend line to invalidate the bearish setup.
If they manage to do that, the pair could attempt a rally to $2,159 where the bulls are likely to encounter strong selling by the bears. The bulls will have to clear this hurdle to suggest the start of a new up-move.
BNB/USD Market Analysis
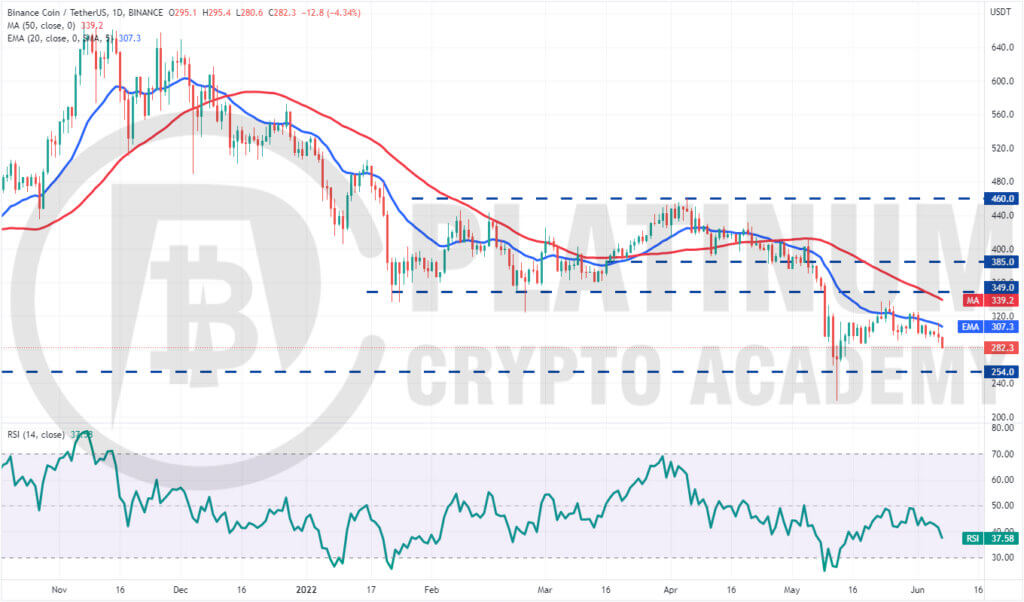
Binance Coin rose above the 20-day EMA on May 30 but the bulls could not sustain the higher levels. That may have tempted the short-term traders to book profits, which pulled the price back below the 20-day EMA on June 1.
The buyers tried to push the price back above the 20-day EMA on June 6 but the bears were in no mood to relent. They defended the level aggressively and pulled the price below the $286 support on June 7.
The downsloping moving averages and the relative strength index (RSI) in the negative territory indicate that bears have the upper hand.
If the price sustains below $286, the BNB/USD pair could decline to the strong support of $254. This is an important level to keep an eye on because if it gives way, the decline could extend to $218.
Alternatively, if the price rebounds off $254 with strength, it will suggest accumulation at lower levels. The pair could then remain stuck inside the large range between $254 and $349 for some more days.
XRP/USD Market Analysis
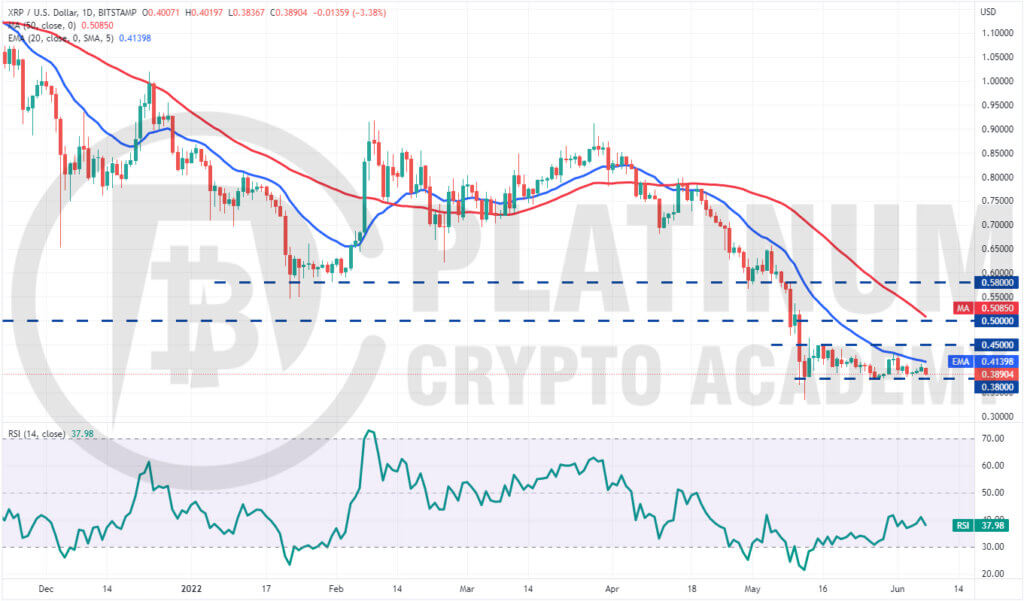
XRP turned down from the 20-day EMA on June 1, indicating that the sentiment remains negative and traders are selling on rallies. The buyers again attempted to push the price above the 20-day EMA on June 6 but failed.
The bears will now attempt to sink the price below the strong support of $0.38. If they succeed, the XRP/USD pair could witness aggressive selling which could pull the pair down to the May 12 intraday low of $0.33.
The bulls are expected to defend the zone between $0.38 and $0.33 with vigour. But if this zone cracks, the downtrend could resume.
Conversely, if the price rebounds off $0.38, it will suggest that bulls are accumulating near this level. A break and close above the 20-day EMA will be the first sign that the sellers may be losing their grip.
The bulls will have to push and sustain the price above the psychological level of $0.50 to suggest that the pair may have bottomed out.
SOL/USD Market Analysis
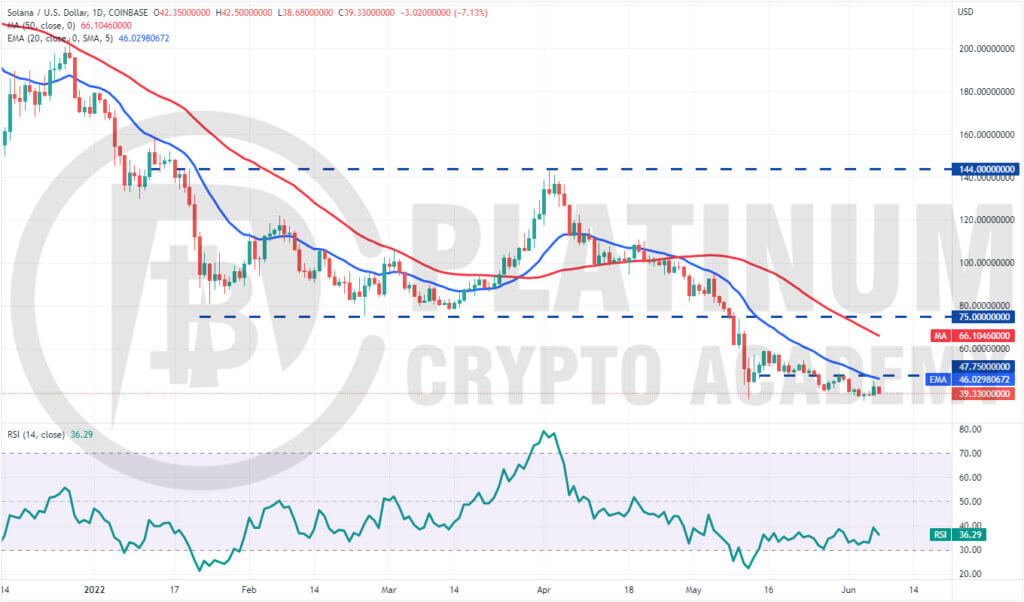
Solana turned down from $47.75 on May 31, indicating that the bears had flipped the level into resistance. This may have intensified selling which pulled the SOL/USD pair below the vital support of $36 on June 4. However, the long tail on the day’s candlestick shows buying at lower levels.
The bulls again tried to start a recovery which hit a wall near the 20-day EMA on June 6. The failure of the bulls to push the price above the 20-day EMA indicates that the sentiment remains negative and traders are selling on rallies.
The bears will now attempt to sink and sustain the price below the June 4 intraday low of $35.66. If they do that, the downtrend could resume. The pair could then decline to $30 and next to $26.
This negative view could invalidate in the short term if bulls push and sustain the price above the 20-day EMA. A break and close above $60 could signal the formation of a double bottom pattern.
Hopefully, you have enjoyed today’s article for further coverage please check out our crypto Blog Page. Thanks for reading! Have a fantastic day! Live from the Platinum Crypto Trading Floor.
Earnings Disclaimer: The information you’ll find in this article is for educational purpose only. We make no promise or guarantee of income or earnings. You have to do some work, use your best judgement and perform due diligence before using the information in this article. Your success is still up to you. Nothing in this article is intended to be professional, legal, financial and/or accounting advice. Always seek competent advice from professionals in these matters. If you break the city or other local laws, we will not be held liable for any damages you incur.


