
Bitcoin continues its sideways price action as bulls defend the psychological $60,000 support while bears sell on rallies. A consolidation near the highs is typically a positive sign as it shows that the bulls are not hurrying to the exit. However, a confirmation only happens after the price breaks above the resistance because if the price drops below the support, it will indicate distribution in the range.
Due to the uncertainty about the next directional move, the spot Bitcoin exchange-traded funds are seeing a muted response. Market research firm Santiment said in a X post that fear and indecision has pulled Bitcoin’s onchain activity toward historic lows.
Analysts at research and brokerage firm Bernstein expect Bitcoin’s flattish price action between high 50,000 to low 60,000 to continue for some more time. As allocation from institutional investors grows, analysts anticipate Bitcoin to breakout to a new all-time high.
A filing with the Securities and Exchange Commission (SEC) shows that the hedge fund Bracebridge Capital owns roughly $434 million worth of spot Bitcoin ETFs—not including options. Separately, quantitative trading firm Susquehanna International Group disclosed the purchase of more than $1 billion worth of shares in Bitcoin ETFs. In addition, several other firms, such as Swiss banking giant UBS, and JPMorgan Chase, have also reported owning Bitcoin ETFs.
Notably, Tokyo-listed Metaplanet said in a press release that it has “adopted Bitcoin as its strategic reserve asset” in response to the Japanese government’s high debt levels, long periods of negative interest rates and consequently weak yen. The firm has bought 117.7 Bitcoin since April.
Bitcoin’s long-term bulls remain positive on the future prospects of the largest cryptocurrency by market capitalization. Twitter co-founder Jack Dorsey said in an interview with journalist Mike Solana that Bitcoin could soar to “at least a million” and “beyond” by 2030.
What are the important support levels to watch out for in Bitcoin and major altcoins? Let’s study the charts to find out.
BTC/USD Market Analysis
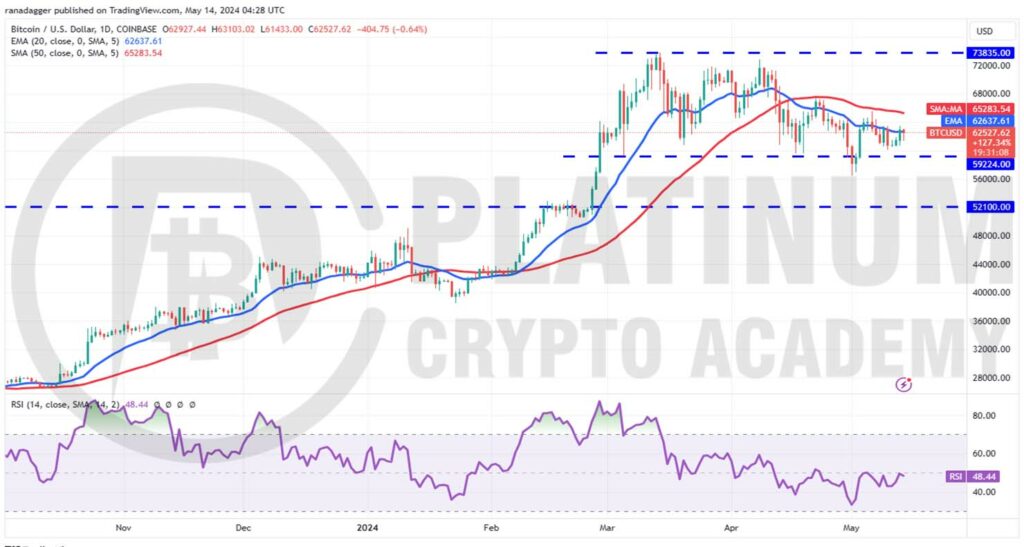
Bitcoin plunged below the $59,224 support on May 1, but the bears could not sustain the lower levels. The bulls pushed the price back above the breakdown level on May 3.
However, the bears have not yet given up. They stalled the recovery at the 50-day simple moving average (SMA) on May 6. Since then, the BTC/USD pair has been oscillating between the 50-day SMA and the solid support at $59,224.
The 20-day exponential moving average (EMA) has flattened out, and the relative strength index (RSI) is near the midpoint, indicating a balance between supply and demand.
If the price continues higher and breaks above the 50-day SMA, the short-term advantage will tilt in favor of the bulls. The pair may climb to the overhead resistance at $73,835.
Contrarily, if the price turns down and breaks below $59,224, it will signal that the bears are trying to take charge. The pair may then slump to $56,500 and later to the vital support at $52,100.
ETH/USD Market Analysis
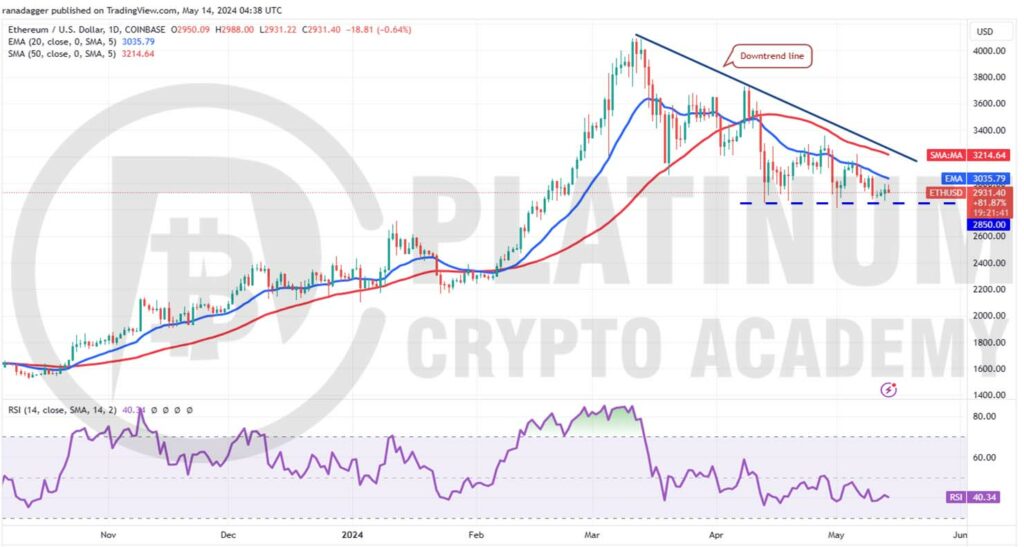
Ether dipped below the $2,850 support on May 1, but the long tail on the day’s candlestick shows solid buying by the bulls at lower levels. The bulls tried but could not overcome the resistance zone between the 20-day EMA and the downtrend line.
That pulled the price back to the crucial support at $2,850. Although the bulls have held the level for the past few days, they have failed to start a meaningful bounce. That indicates a lack of demand at higher levels.
The downsloping moving averages and the RSI in the negative territory indicate advantage to sellers. If the price dives and maintains below $2,850, the next leg of the downtrend could begin.
The ETH/USD pair could collapse to $2,700, where the bulls will attempt to stall the decline. This negative view will be invalidated in the near term if the price turns up and breaks above the downtrend line. Such a move will signal that the correction may have ended.
BNB/USD Market Analysis
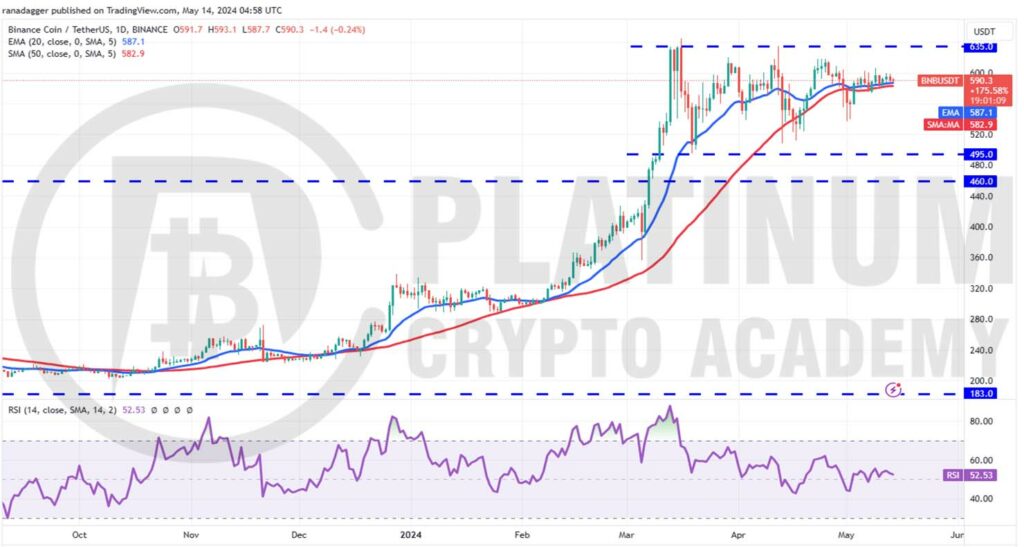
Binance Coin has been trading above the moving averages for several days, but the bulls have failed to propel the price to the overhead resistance of $635. This shows that bears remain active at higher levels.
The flattish moving averages and the RSI near the midpoint do not give a clear advantage either to the bulls or the bears.
If buyers propel the price above the immediate resistance at $606, the likelihood of a rally to $635 increases. A break and close above this resistance could start the next leg of the uptrend to $692.
Conversely, if bulls fail to start a rally, the pair may turn down and skid below the moving averages. If that happens, the BNB/USD pair may drop to $536 and then to the critical support at $495.
Buyers are expected to defend this level with vigor. A strong bounce off $495 could keep the pair inside the range for some more time.
XRP/USD Market Analysis
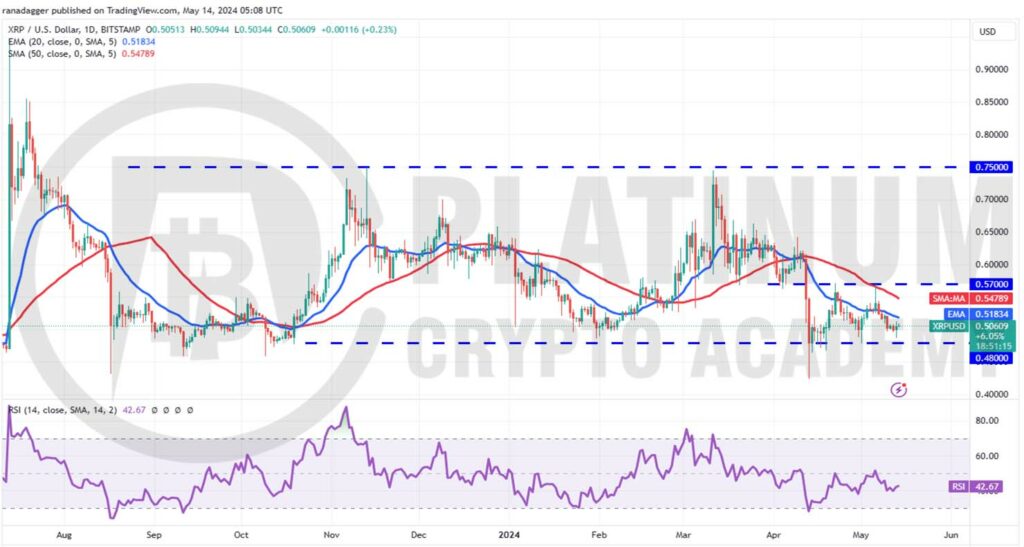
XRP turned down from the $0.57 overhead resistance on May 6, indicating that the bears are fiercely defending the level. The price slipped near the critical support of $0.48 on May 13, but the bulls held their ground.
If buyers clear the overhead hurdle at the 20-day EMA, it will suggest that the XRP/USD pair may swing between $0.57 and $0.48 for a few more days. A break above $0.48 will indicate that the bulls are back in the game.
On the other hand, if the price turns down from the 20-day EMA, it will signal that the bears are selling on every minor rally. That will enhance the prospects of a break below $0.48. If that happens, the pair may plummet toward $0.42. The bulls are expected to aggressively buy in the zone between $0.42 and $0.48.
ADA/USD Market Analysis
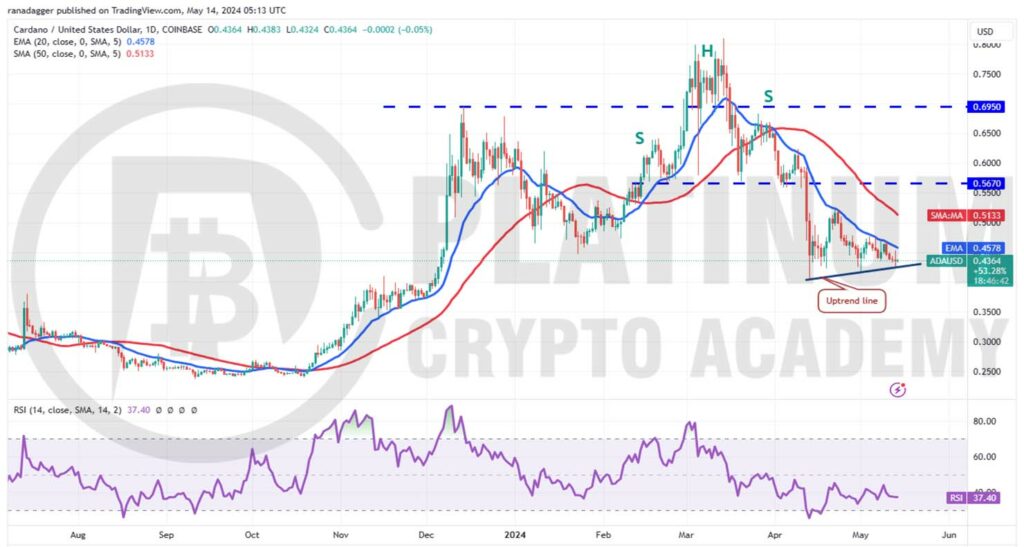
Cardano’s price is squeezed between the 20-day EMA and the uptrend line, suggesting an imminent breakout in the next few days.
The downsloping moving averages and the RSI in the negative zone indicate that bears are in command. If the price breaks and sustains below the uptrend line, it will suggest that the bears have overpowered the bulls. The ADA/USD pair could drop to $0.40 and thereafter dive to the strong support at $0.35. This level is likely to attract buyers.
On the contrary, if the price turns up from the current level and breaks above the 20-day EMA, it will indicate that the bulls have absorbed the supply. That could set the stage for a rally to the 50-day SMA, where the bears may again mount a strong resistance.
Hopefully, you have enjoyed today’s article for further coverage please check out our crypto Blog Page. Thanks for reading! Have a fantastic day! Live from the Platinum Crypto Trading Floor.
Earnings Disclaimer: The information you’ll find in this article is for educational purpose only. We make no promise or guarantee of income or earnings. You have to do some work, use your best judgement and perform due diligence before using the information in this article. Your success is still up to you. Nothing in this article is intended to be professional, legal, financial and/or accounting advice. Always seek competent advice from professionals in these matters. If you break the city or other local laws, we will not be held liable for any damages you incur.
")