Bitcoin and Nasdaq 100 have been clobbered in 2022 as both are down about 15% but in the same period, gold has risen about 10%. This shows that in a high inflation, rising rate environment, investors have shunned assets perceived as risky and are sticking to gold, which is a proven inflation hedge.
However, Mohamed El-Erian, Chief Economic Advisor for Allianz, in an interview with CNBC said that if the US Federal Reserve changes its long-term inflation target to 3%, both gold and Bitcoin are likely to go higher.
While the short-term price action may be negative, Bitcoin whales are using this weakness to accumulate for the long term. The Luna Foundation Guard (LFG) continued to buy in the past week, boosting its stockpile to 42,530.82 Bitcoin, making it the 18th largest Bitcoin wallet, according to data from BitInfoCharts.
In a letter to investors, MicroStrategy CEO Michael Saylor said that the firm’s “parallel strategy to acquire and hold bitcoin has been a tremendous success.” He added that the company will “vigorously pursue” the strategy to grow the enterprise analytics software business and the strategy to make Bitcoin the primary treasury reserve asset.
Another positive sign has been that Bitcoin balances on the crypto exchanges have continued to decline. Data from on-chain analytics firm CryptoQuant shows that the cumulative balance of Bitcoin at 21 major exchanges has declined to its lowest level since July 2018. This suggests that investors have been withdrawing their Bitcoin to HODL for the long term.
Has Bitcoin and the major altcoins bottomed out or could the decline extend further? Read our analysis of the major cryptocurrencies to find out.
BTC/USD Market Analysis
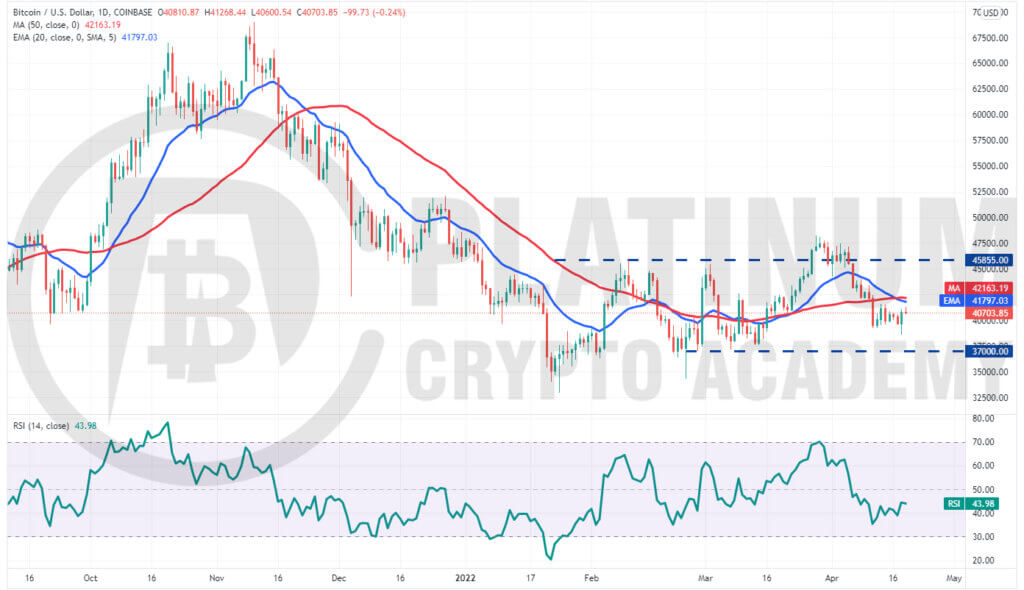
The buyers attempted to push Bitcoin back above the 50-day simple moving average (SMA) on April 13 and 14 but the bears did not relent. This suggests that bears are trying to flip the 50-day SMA into resistance.
The bears tried to extend the correction on April 18 but the long tail on the day’s candlestick shows strong buying at lower levels. The recovery is likely to face strong resistance at the moving averages.
The downsloping 20-day exponential moving average (EMA) and the relative strength index (RSI) in the negative territory suggest that bears have a slight edge.
If the price turns down from the moving averages, the possibility of a drop to $37,000 increases. The buyers are expected to defend this level aggressively.
If the price rebounds off $37,000 with strength, it will suggest that the BTC/USD pair could remain range-bound for a few more days.
If the price turns up from the current level and rises above the 50-day SMA, the short-term momentum may shift in favour of buyers. The pair could then rally to $44,000 and later to $45,855.
ETH/USD Market Analysis
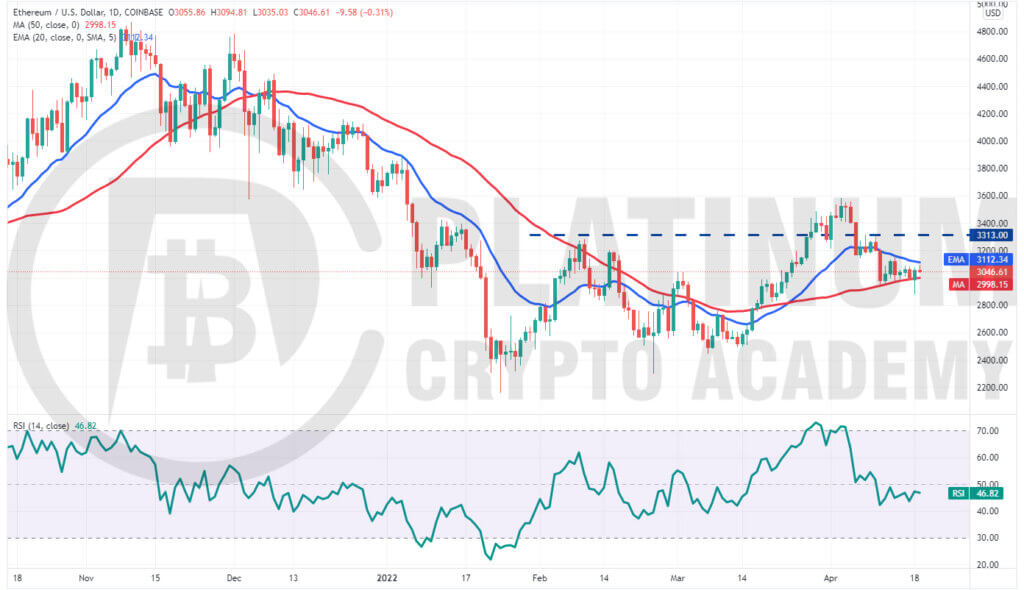
The bears pulled Ether below the 50-day SMA on April 18 but the long tail on the day’s candlestick shows strong buying by the bulls at lower levels. The price recovered sharply and closed back above the 50-day SMA.
However, the bulls continue to face stiff resistance at the 20-day EMA. If the price once again breaks below the 50-day SMA, the bears will attempt to pull the ETH/USD pair below $2,880.
If they succeed, the selling momentum may pick up and the pair could slide toward the strong support at $2,450.
Contrary to this assumption, if bulls propel the price above the 20-day EMA, the pair could rally to $3,313 and later to the overhead resistance at $3,581.
The coiling of the price action suggests a range expansion in the near term but it is difficult to predict the direction of the breakout. Hence, traders could wait for the price to break above or below the moving averages before establishing positions.
BNB/USD Market Analysis
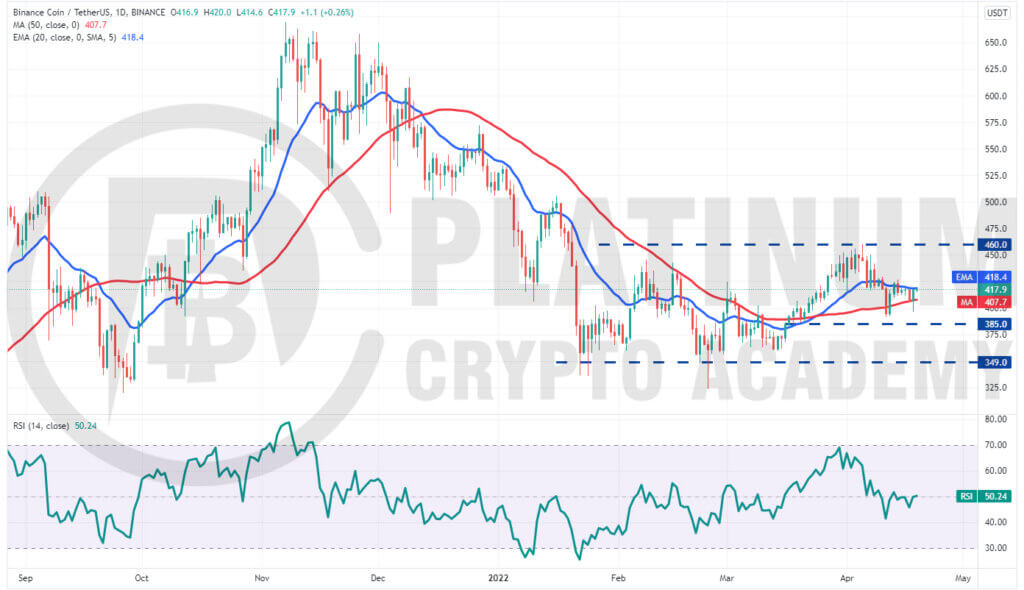
Binance Coin slipped below the 50-day SMA on April 18 but the bears could not capitalise on this advantage. This suggests that bulls are buying on dips close to the strong support at $385.
The failure of the bears to sustain the lower levels increases the possibility of a break above the 20-day EMA. If that happens, the BNB/USD pair could attempt a rally to the overhead resistance at $460.
The flattish 20-day EMA and the RSI near the midpoint suggest a range-bound action in the short term.
Alternatively, if the price turns down from the 20-day EMA, it will suggest that bears are defending this level. That could keep the pair stuck between the 20-day EMA and $385 for some time.
XRP/USD Market Analysis
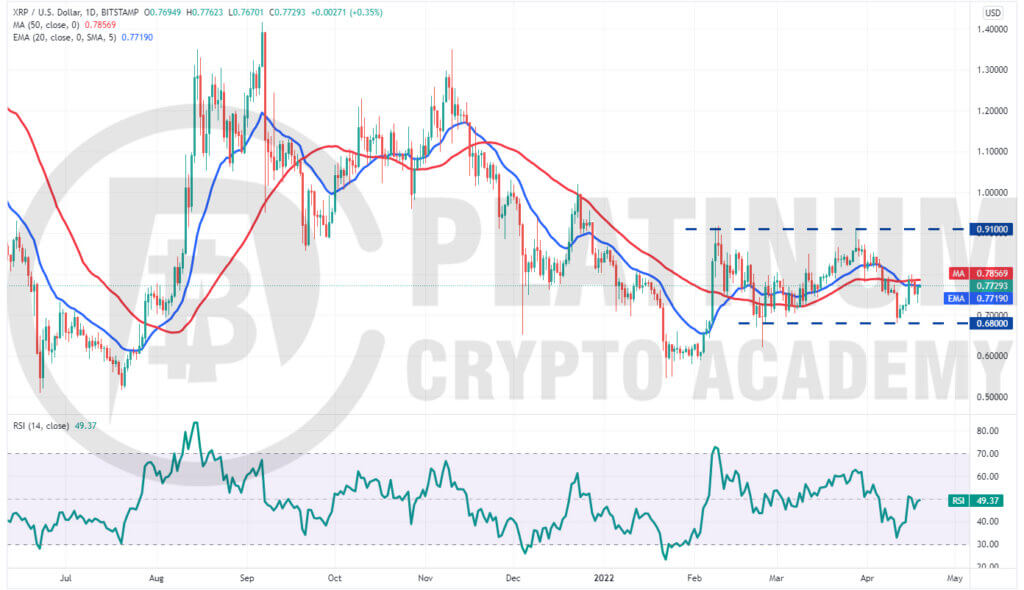
XRP rebounded off the support at $0.68 on April 12 suggesting that bulls are actively defending this level. This suggests that the XRP/USD pair could remain range-bound between $0.68 and $0.91 for a few more days.
The flat moving averages and the RSI near the midpoint also indicate a consolidation in the near term.
If the price breaks above $0.80, the buyers will attempt to push the pair to $0.85 and later to the overhead resistance at $0.91. This is an important level for the bulls to overcome because if they manage to do that, the pair could start a new uptrend.
On the other hand, if the price turns down from the current level, the bears will try to pull the pair below $0.72 and challenge the strong support at $0.68. A break and close below this level could clear the path for a possible decline to $0.60.
LUNA/USD Market Analysis
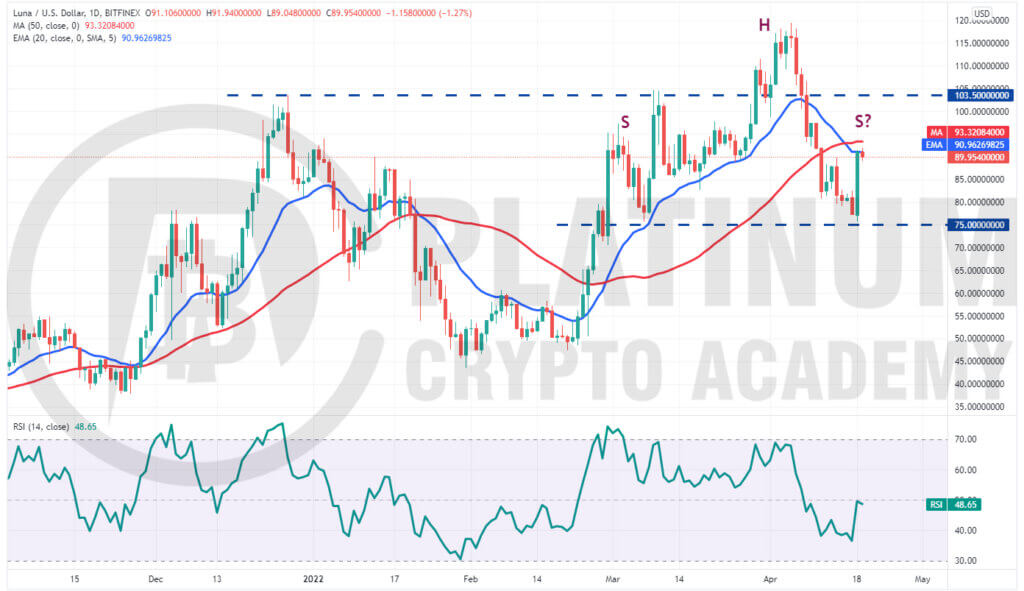
We had projected Terra’s LUNA token to drop to the strong support at $75 in our previous analysis and that is what happened.
The bulls aggressively purchased the dip which resulted in a sharp rebound on April 18. The recovery is facing resistance at the 20-day EMA, indicating that bears are selling on rallies.
If the price turns down sharply from the current level, the bears will make one more attempt to sink and sustain the pair below $75. If they succeed, the pair will complete a head and shoulders pattern, which could be a huge negative.
On the other hand, if the price turns up and breaks above the 50-day SMA, the pair could rally to the overhead resistance zone between $100 and $103.50. The bears are expected to defend this zone but if bulls clear this hurdle, the pair could retest the all-time high of $119.44.
The 20-day EMA is flattening out and the RSI is near the midpoint, which does not give a clear advantage either to the bulls or the bears.
Hopefully, you have enjoyed today’s article for further coverage please check out our crypto Blog Page. Thanks for reading! Have a fantastic day! Live from the Platinum Crypto Trading Floor.
Earnings Disclaimer: The information you’ll find in this article is for educational purpose only. We make no promise or guarantee of income or earnings. You have to do some work, use your best judgement and perform due diligence before using the information in this article. Your success is still up to you. Nothing in this article is intended to be professional, legal, financial and/or accounting advice. Always seek competent advice from professionals in these matters. If you break the city or other local laws, we will not be held liable for any damages you incur.


