August’s nonfarm payrolls data offered some relief to traders as the economy added 315,000 jobs for the month, well below the 526,000 in July. It was the lowest monthly gain since April 2021, increasing hopes that the data leaves some scope for the Federal Reserve to soften its aggressive tightening policy. The CME FedWatch Tool showed a 60% probability of a 75 basis points rate hike for the September 21 meeting, down from 75% on August 29.
The Dow Jones Industrial Average initially rallied by 370 points following the jobs report but it later trimmed its gains and closed down by 337.98 points. The Nasdaq Composite extended its losing streak to six consecutive days for the first time since 2019.
Along with the weakness in the United States equities markets, the macroeconomic situation worsened further as Russia halted gas supply to Europe. This stoked fears of an energy crisis and pulled the euro to a 20-year low versus the US dollar. The US dollar index, which is usually inversely correlated to Bitcoin, rose to a two-decade high above 110.
A minor positive among the slew of negative news is that Bitcoin bulls have managed to hold on to the $20,000 mark for the past few days. That could be because several investors have not panicked in the ongoing bear market and are holding their positions. Glassnode data on September 5 showed that 65.781% of wallets have held Bitcoin for a year or more.
For the next few days, the crypto markets are likely to shift focus to Ethereum’s Merge, which is expected to happen on September 15. Data from Ethernodes showed that 72.8% of Ethereum nodes were “Merge ready” before the Bellatrix upgrade scheduled for September 6. Ethereum co-founder Vitalik Buterin and core developer Tim Beiko have appealed to the remaining node operators to update before the Bellatrix upgrade else the clients will “sync to the pre-fork blockchain” and will “be unable to send Ether or operate on the post-Merge Ethereum network.”
How will the crypto markets react to Ethereum’s upgrade? What do the charts suggest? Read our analysis of the major cryptocurrencies to find out.
BTC/USD Market Analysis
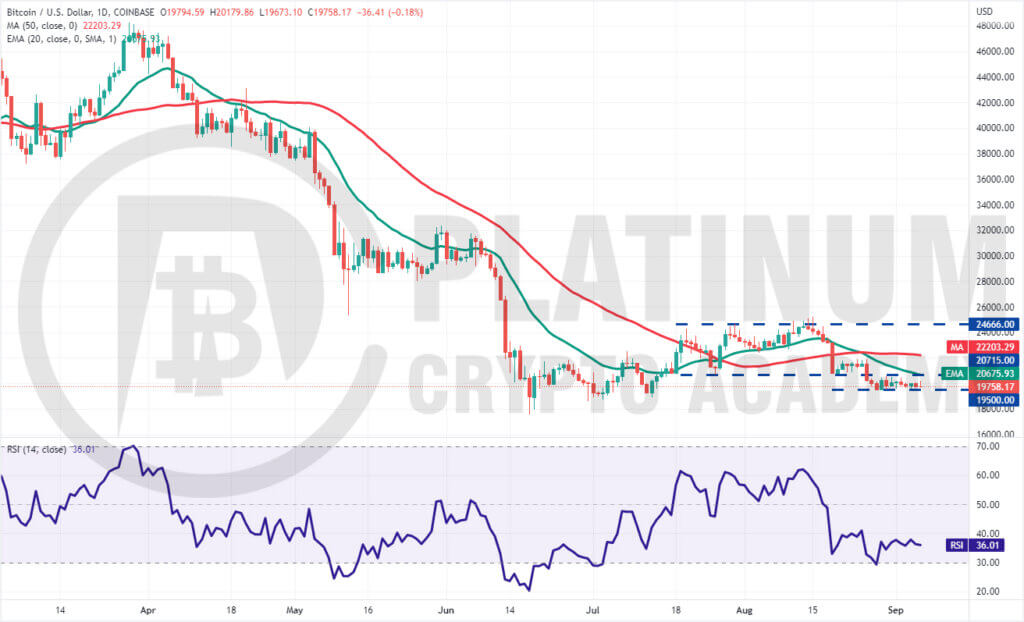
Bitcoin has been trading inside a tight range between $19,500 and $20,715 for the past few days. The failure to push the price back above $20,715 indicates that bears are trying to flip this level into resistance.
The downsloping 20-day exponential moving average (EMA) and the relative strength index (RSI) in the negative territory indicate advantage to sellers.
If bears sink the price below $19,500, the selling could intensify and the BTC/USD pair could drop to the next support zone between $18,600 and $17,567.45. The bulls are expected to defend this zone aggressively because a failure to do so could signal the resumption of the downtrend. The pair could then slide to $16,764.
Contrary to this assumption, if the price turns up from the current level and breaks above $20,715, it will suggest that bulls are back in the game. That could push the price to the 50-day simple moving average (SMA). This level may again act as a resistance but if bulls overcome this barrier, the pair could rally to $24,666.
ETH/USD Market Analysis
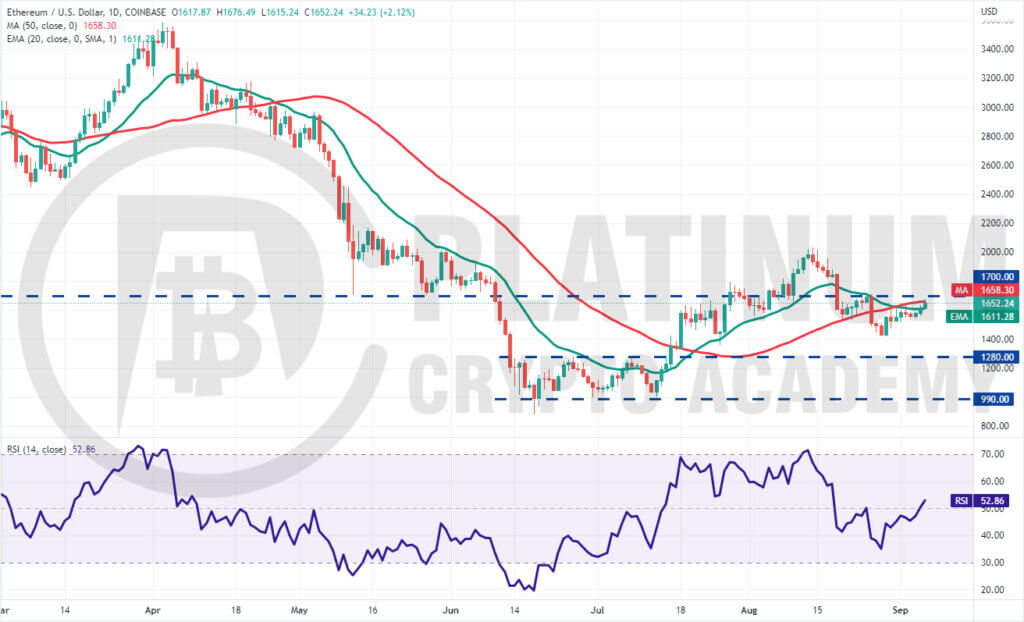
Ether has been clinging to the moving averages for the past few days. Though the bulls failed to push the price above the 50-day SMA, a positive sign is that they have not ceded ground to the bears.
The 20-day EMA has flattened out and the RSI has climbed into the positive territory, indicating that the selling pressure could be reducing. The buyers will make one more attempt to push the price above the overhead resistance at $1,700.
If they succeed, the ETH/USD pair could pick up momentum and rally toward the stiff resistance at $2,032. This level is likely to attract aggressive selling by the bears but if bulls absorb the supply, the likelihood of a rally to $2,200 increases. Such a move will indicate that the downtrend could be over.
Contrary to this assumption, if the price turns down from $1,700, it will suggest that bears are active at higher levels. The sellers will then make another attempt to sink the pair below $1,420 and challenge the strong support at $1,280.
BNB/USD Market Analysis
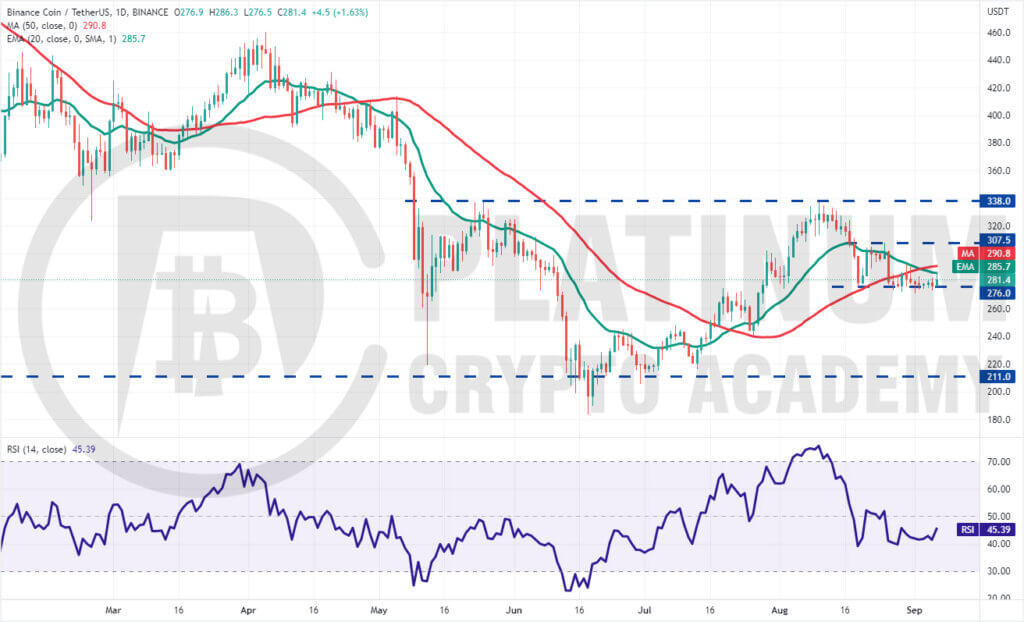
We mentioned in our previous analysis that bulls will encounter stiff resistance from the bears at the 20-day EMA and that is what happened on August 30 and 31.
But a minor positive is that the bulls did not allow Binance Coin to dip and sustain below the strong support at $276. This suggests that bulls continue to buy on dips.
The buyers are again attempting to push the price above the moving averages. If they manage to do that, the BNB/USD pair could rally to the overhead resistance at $307.50. If the price turns down from this level, the pair could extend its range-bound action for a few more days.
Another possibility is that the price turns down from the moving averages and breaks below $276. Such a move could give control back to the bears. The pair could then start its decline to $240.
XRP/USD Market Analysis
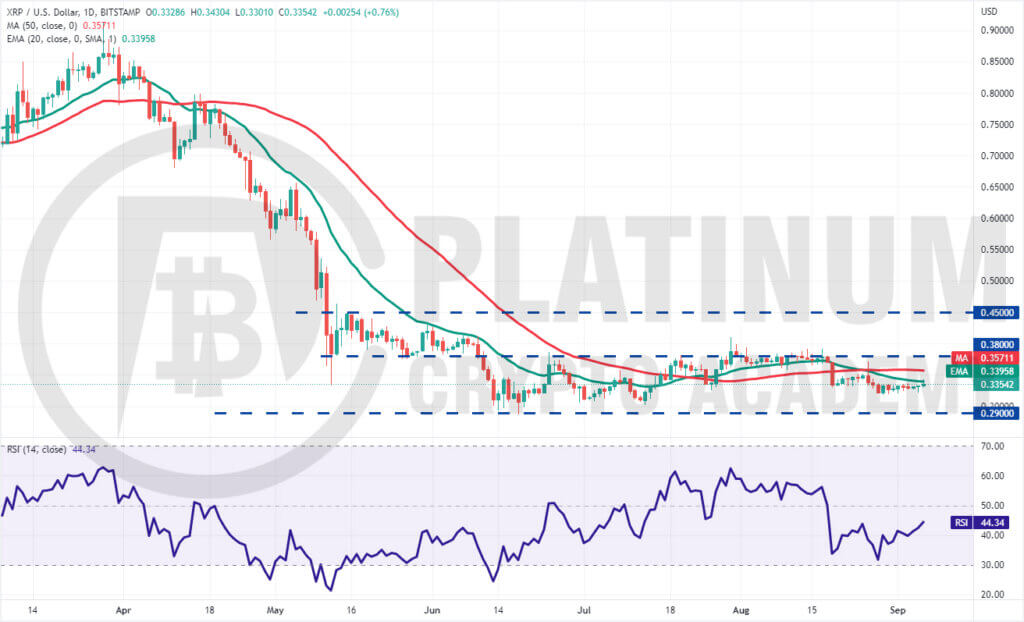
XRP has been stuck inside a large range between $0.29 and $0.38 for the past several days. The price action inside a range is usually random and volatile, hence the best time is to buy on a rebound off the support and sell near the resistance.
The XRP/USD pair has been trading below the 20-day EMA for the past few days but the bears have not been able to sink the price to the strong support at $0.29. This suggests a lack of aggressive selling at lower levels.
Buyers will now try to push the price above the 20-day EMA. If they do that, the pair could rise to the 50-day SMA and then to the stiff overhead resistance at $0.38.
The pair could start a trending move on a break above $0.38 or below $0.29. Until then, the pair may continue its consolidation. The flattening moving averages and the RSI above 44 also suggest a few more days of range-bound action.
ADA/USD Market Analysis
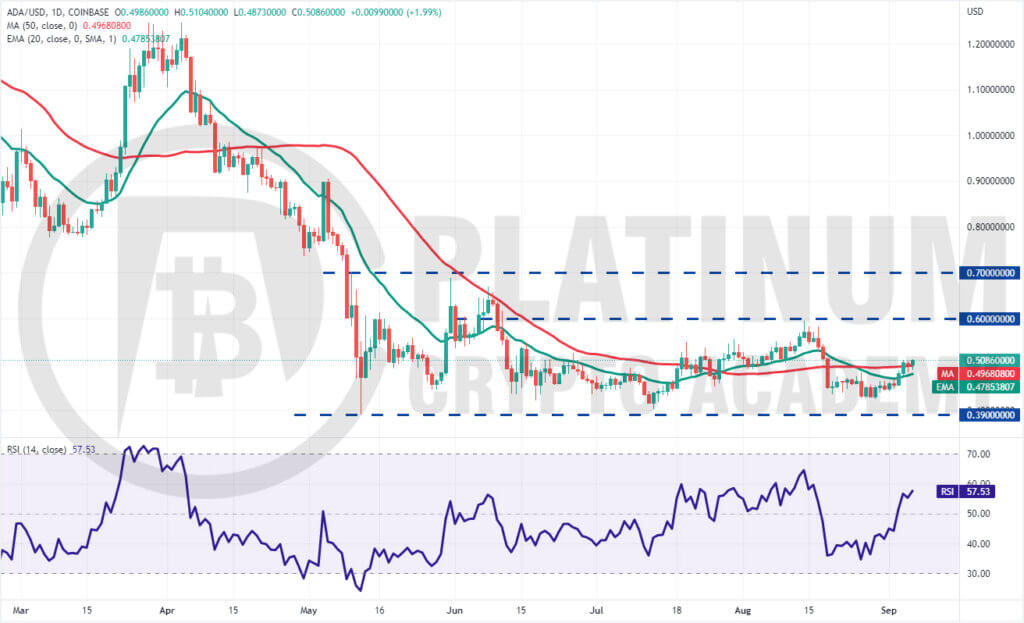
The bulls pushed Cardano above the 20-day EMA on September 3 and followed that up with another move higher on September 4, which cleared the hurdle at the 50-day SMA.
The bears tried to pull the price back below the moving averages on September 5 but the long tail on the day’s candlestick shows strong buying at lower levels.
The 20-day EMA has started to turn up and the RSI is in the positive territory, indicating advantage to buyers. If bulls sustain the price above $0.51, the pair could pick up momentum and rally toward the stiff overhead resistance at $0.60.
This positive view could invalidate in the short term if the price turns down and breaks below the 20-day EMA. Such a move will suggest that higher levels continue to attract strong selling. That could pull the price down to $0.42 and then to $0.39.
.
Hopefully, you have enjoyed today’s article for further coverage please check out our crypto Blog Page. Thanks for reading! Have a fantastic day! Live from the Platinum Crypto Trading Floor.
Earnings Disclaimer: The information you’ll find in this article is for educational purpose only. We make no promise or guarantee of income or earnings. You have to do some work, use your best judgement and perform due diligence before using the information in this article. Your success is still up to you. Nothing in this article is intended to be professional, legal, financial and/or accounting advice. Always seek competent advice from professionals in these matters. If you break the city or other local laws, we will not be held liable for any damages you incur.


