
Bitcoin has been consolidating inside a large range for the past several months. Although October has historically produced positive results for Bitcoin, the bulls are struggling to repeat the performance in 2023. The high interest rate environment and the Israel-Hamas conflict have increased the uncertainty, limiting the upside in the near term.
While inflation and war may have kept prices down in the short term, Billionaire investor Paul Tudor Jones said in a recent interview with CNBC that he “can’t love stocks” but he is in love with “Bitcoin and gold.” He expects the risk-off sentiment to prevail if the Israel-Hamas confrontation escalates further.
Another bullish voice for the long term was from BitMEX founder Arthur Hayes. While speaking as a guest on Impact Theory with Tom Bilyeu, Hayes said that there is likely to be a major financial crisis near the end of the decade. However, before that happens, the government will try to intervene and avoid a crisis by printing more money. That could result in a huge “bull market in stocks, real estate, crypto, art, you name it, that we’ve ever seen since WW2.” Hayes expects Bitcoin to reach between $750,000 to $1 million by 2026.
One of the major triggers for Bitcoin’s next bull market could be the approval of a spot Bitcoin exchange-traded fund. Bloomberg ETF analyst James Seyffart said on X (formerly Twitter) that there is a 90% possibility of a spot Bitcoin ETF receiving the Securities and Exchange Commission’s greenlight in January 2024.
Another bullish event being watched for is the upcoming Bitcoin halving in April 2024. Crypto analyst Miles Deutscher cited a chart from CryptoCon, stating that in pre-halving years, Bitcoin remains stuck in a range from Q2 to Q4. The important date to note is November 21 as Bitcoin tends to take off around this period, heading into the next halving.
Could Bitcoin start the next leg of the uptrend? Will altcoins also follow Bitcoin higher? Let’s study the charts to find out.
BTC/USD Market Analysis
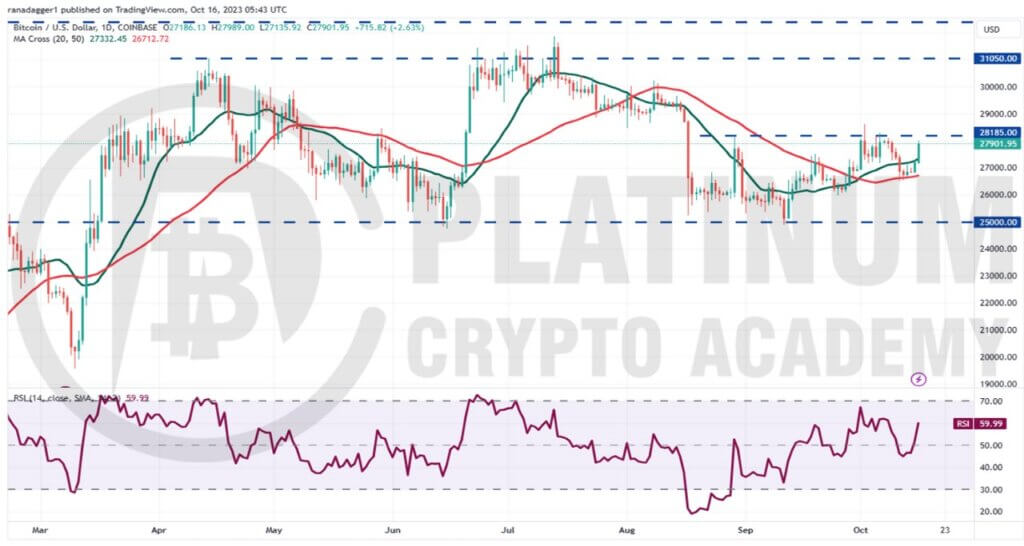
Bitcoin bounced off the 20-day simple moving average (SMA) on October 6 but the bulls could not clear the overhead hurdle at $28,185. This indicates that the bears are guarding the level with vigor.
The failure to break above the resistance may have tempted short-term bulls to book profits. That pulled the price below the 20-day SMA on October 11 but a minor positive is that the bulls held the support at the 50-day SMA. This indicates buying at lower levels.
The gradually rising moving averages and the relative strength index (RSI) in the positive territory indicate advantage to buyers. The price has again reached near the overhead resistance of $28,185.
The repeated retest of a resistance level in short intervals tends to weaken it. If bulls overcome this barrier, the BTC/USD pair could start a rally to $30,000 and thereafter to $31,050.
On the contrary, if the price turns down sharply from $28,185, it will indicate that the pair may extend its stay inside the range for some more time.
On the downside, the important support levels to watch out for are the 50-day SMA and then $26,000. If bears sink the price below this zone, the pair may plummet to the vital support at $25,000.
ETH/USD Market Analysis
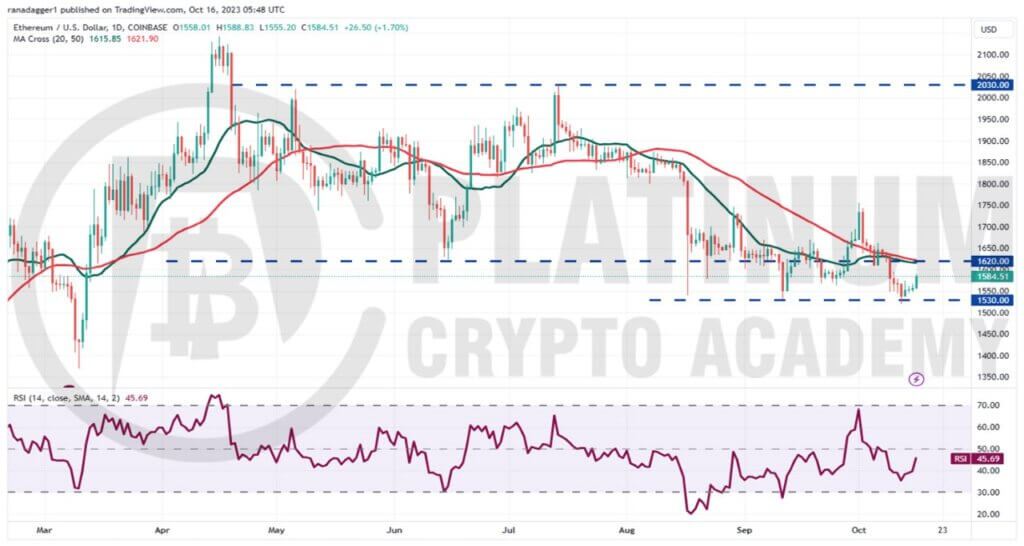
Ether reversed direction from $1,755 on Oct. 1 and plunged below the moving averages on October 5. This was an indication that the bulls were rushing to the exit. The bulls pushed the price back above the moving averages on October 6 but they could not sustain the higher levels.
This indicates that the sentiment remains negative and traders are selling on rallies. The bears eventually pulled the price back to the critical support at $1,530 on October 12.
Buyers successfully protected the $1,530 levels in the past few days which is a positive sign. The recovery is likely to reach the moving averages, which are expected to act as a formidable resistance.
If the price turns down from the moving averages, it will increase the likelihood of a drop below $1,530. The next support on the downside is at $1,370.
Contrarily, if bulls kick the price above the moving averages, it will clear the path for a potential rally to $1,755.
BNB/USD Market Analysis
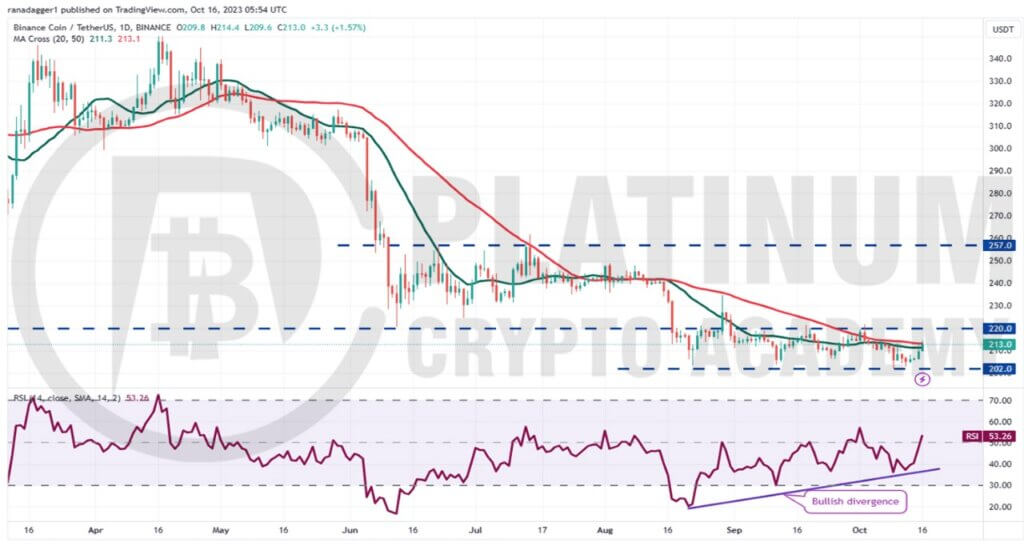
Binance Coin has been oscillating inside the $203 to $220 range for the past few days. We cautioned in the previous analysis that a break below the 20-day SMA could open the gates for a potential fall to $203 and that is what happened. The BNB/USD pair slipped to $202 on October 9.
A minor positive in favor of the buyers is that the RSI is forming a bullish divergence, indicating that the selling pressure is reducing. That enhances the prospects of a rally to $220.
This level is again likely to witness a strong defense by the bears. On the way down, if the price rebounds off the moving averages, it will signal that traders are buying on minor dips. The pair may then surge to $235 and later to $257.
Contrary to this assumption, if the price turns down from the moving averages, it will signal that the sentiment remains bearish and every minor rally is being sold into. The bears will then try to yank the price below $202. If they succeed, the pair could collapse to $183.
XRP/USD Market Analysis
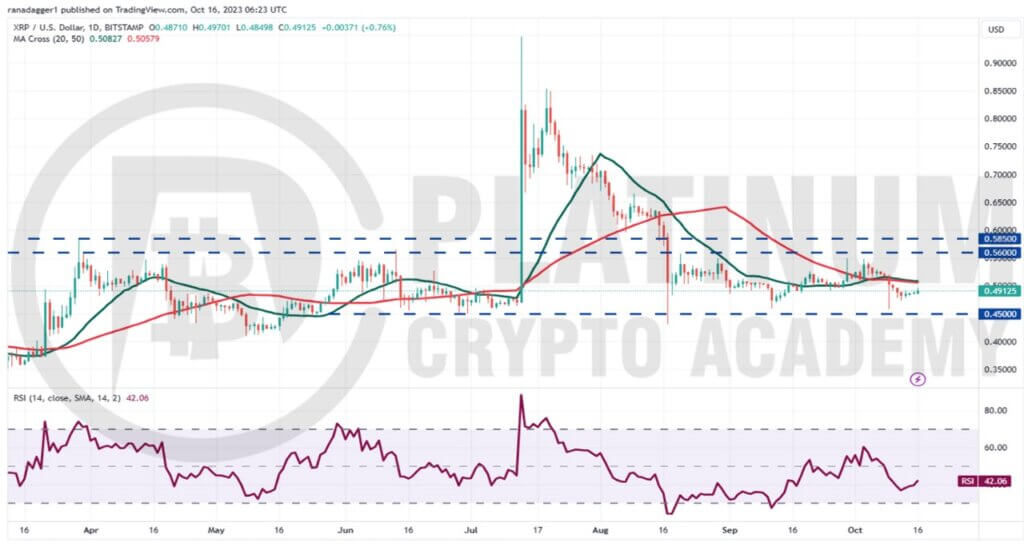
XRP has been trading between $0.56 and $0.45 for the past several days. The bears tried to sink the price below the support on October 9 but the long tail on the candlestick shows solid buying at lower levels.
However, the failure of the bulls to push the price back above the moving averages is a negative sign. It shows that demand dries up at higher levels. The bears will make one more attempt to sink the price below $0.45.
If they manage to do that, the pair may tumble to the next strong support at $0.40.
Contrary to this assumption, if the price turns up from the current level and breaks above the moving averages, the pair could once again reach the overhead resistance at $0.56. This remains the key level to watch for on the upside. If buyers overcome this obstacle, the XRP/USD pair could soar to $0.67.
ADA/USD Market Analysis
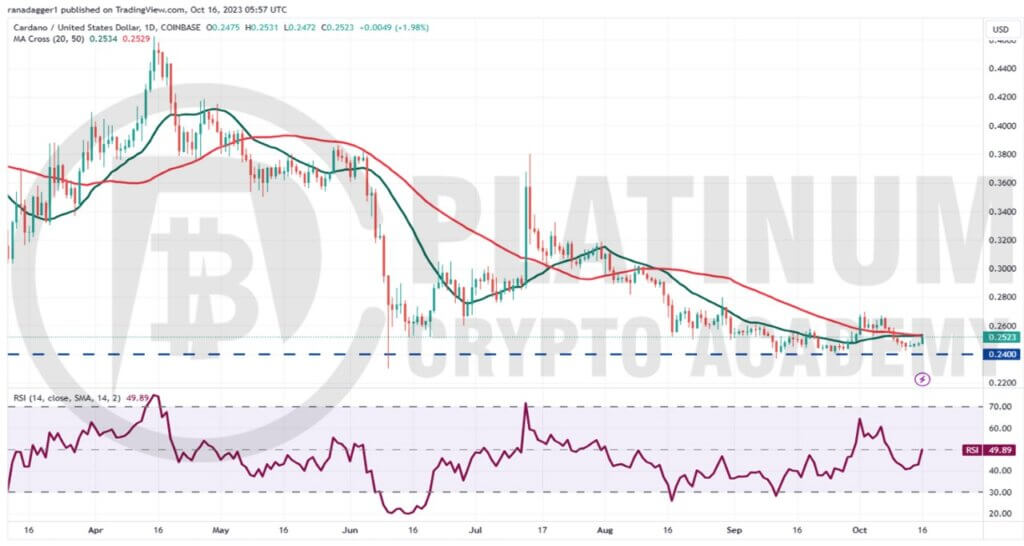
The failure of the bulls to propel the price above the overhead resistance at $0.28 may have attracted profit-booking by the short-term bulls. That pulled the price to the strong support at $0.24 on October 12.
Buyers are trying to start a rebound which is likely to face strong selling at the moving averages. If the price turns down from this resistance, it will increase the likelihood of a break below $0.24. The ADA/USD pair may then slide to $0.22 and later to $0.20.
Alternatively, if the price continues higher and breaks above the moving averages, it will indicate aggressive buying at lower levels. The pair may then attempt a rally to $0.28.
A break and close above this level will indicate the start of a sustained recovery. The next stop on the upside is likely to be $0.32 and then $0.34.
Hopefully, you have enjoyed today’s article for further coverage please check out our crypto Blog Page. Thanks for reading! Have a fantastic day! Live from the Platinum Crypto Trading Floor.
Earnings Disclaimer: The information you’ll find in this article is for educational purpose only. We make no promise or guarantee of income or earnings. You have to do some work, use your best judgement and perform due diligence before using the information in this article. Your success is still up to you. Nothing in this article is intended to be professional, legal, financial and/or accounting advice. Always seek competent advice from professionals in these matters. If you break the city or other local laws, we will not be held liable for any damages you incur.
