
Hi Crypto Network,
BitMEX Research recently pointed out that the correlation between the S&P 500 and Bitcoin (BTC) has reached a new high, eclipsing the previous high recorded in March 2018.
This shows that with all the money being printed to support the economy, a tiny bit might be finding its way into the crypto space, which is a huge positive.
Over the long-term, only a fraction of the total stimulus packages announced around the world are enough to boost the crypto market capitalization.
The coronavirus pandemic has only worsened this week and has engulfed almost the whole world. Several countries in Europe and the US have been the worst affected outside of China where the virus started. While the world attempts to tackle the spread of the virus by lockdowns, it is having a huge negative impact on the economy.
In order to support the economy, the US announced a stimulus package of $2.2 trillion, which is the largest in history. Meanwhile, the Fed’s balance sheet continues to swell and has crossed $5 trillion in assets.
As traders, our focus is the price action. However, during these difficult times, it is heartening to see that various agencies and nations are taking the help of blockchain technology to fight the coronavirus pandemic. Along with helping with the technology part, we are very happy to note that the global crypto community has come together and is also doing its bit to help during this time of crisis.
The current crypto recovery is being led by Bitcoin as its dominance rate closes in on 66%. This raises the question of whether cryptocurrencies sustain the current relief rally and start a sustained uptrend? Let’s analyze the charts.
BTC/USD
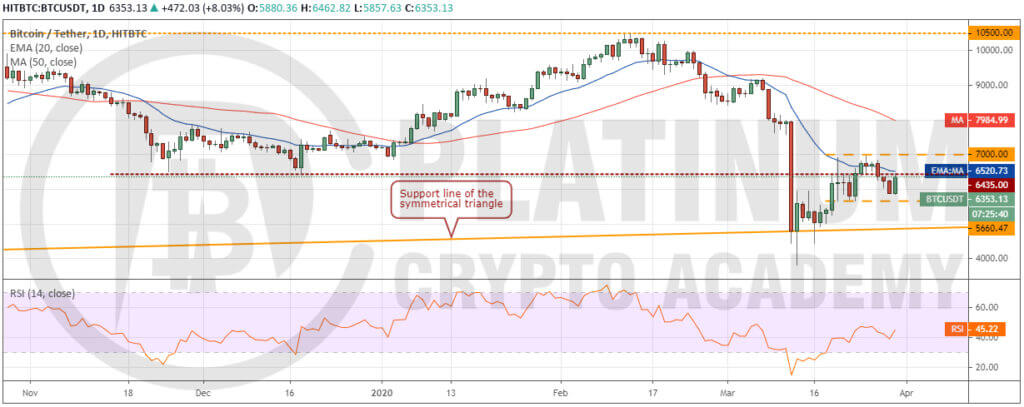
The failure of the bulls to propel Bitcoin (BTC) above the overhead resistance of $7,000 attracted selling. That dragged the price below the immediate support of $6,435 but the bears could not break the next support of $5,660.47. This is a positive sign as it shows demand at lower levels.
Currently, the bulls are again attempting to carry the price above $6,435 and the 20-day EMA at $6,520. If successful, a retest of $7,000 is possible. Above this level, a move to the 50-day SMA at $7,985 and above it to $9,000 is likely.
Contrary to our assumption, if the BTC/USD pair turns down from the 20-day EMA and slides below the support at $5,660.47, a drop to the long-term support line at $5,000 is possible. For now, the traders can protect their long positions with stops at $5,600.
ETH/USD
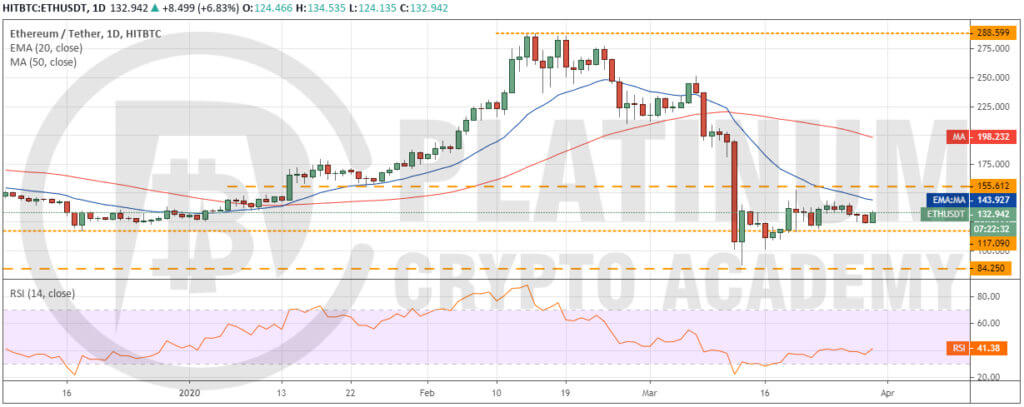
Ether (ETH) continues to trade between the $117.090-$155.612 range. The 20-day EMA is sloping down and the RSI is in the negative zone, which suggests that the bears have the upper hand.
A break below the range can sink the ETH/USD pair to $100 and below it to $84.250. However, if the pair bounces off the support of the range, a few more days of consolidation is likely.
The pair will pick up momentum on a break above $155.612. Above this level, a move to the 50-day SMA at $198 is possible. Therefore, we retain the buy recommendation given in an earlier analysis.
XRP/USD
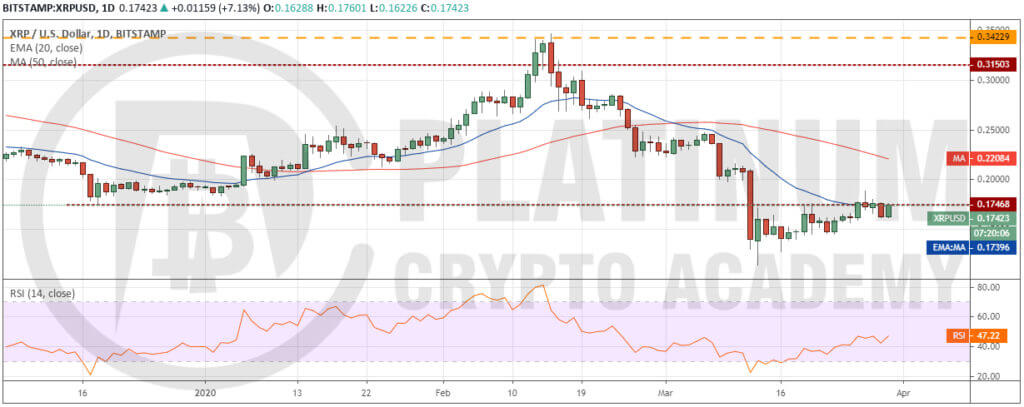
The failure of the bulls to sustain XRP above $0.17468 attracted selling. The bears attempted to resume the down move on March 29 but the bulls provided support close to $0.16 levels.
If the bulls can propel the price above $0.17468 once again and sustain the level, the XRP/USD pair is likely to pick up momentum. The first target to watch on the upside is $0.22 and above it $0.25.
Contrary to our assumption, if the price turns down from $0.17468 once again, the bears will try to sink it to $0.1275. Hence, the stop loss on the long positions can be retained at $0.143 for now. We shall suggest trailing the stop to $0.16 after the pair rises above $0.19.
BCH/USD
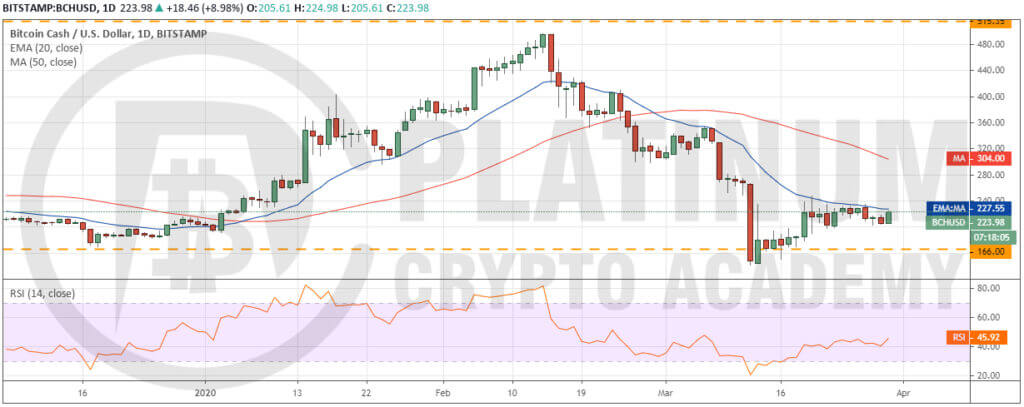
Bitcoin Cash (BCH) turned down from the 20-day EMA on March 27 but the buyers stepped in just above the immediate support at $197.43. This is a positive sign as it shows demand on dips.
The bulls will now try to drive the price above the 20-day EMA at $227 and the horizontal resistance at $247.95. If successful, the BCH/USD pair is likely to pick up momentum and rally to the 50-day SMA at $304 and above it to $350.
Hence, the traders can buy above $250 and keep a stop loss below $197. Our view will be invalidated if the pair plummets below $197.43. In such a case, a drop to $166 is likely.
BSV/USD
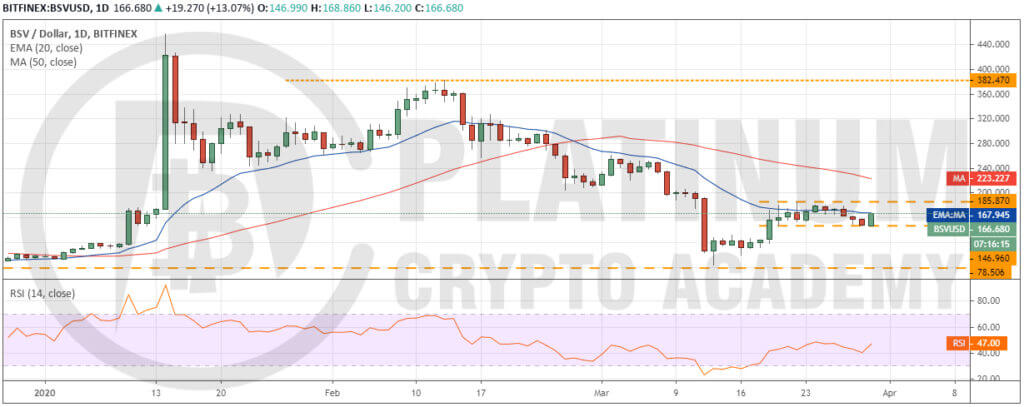
Bitcoin SV (BSV) turned down from the 20-day EMA on March 27. However, the bulls held the strong support at $146.96, which shows buying on dips. The 20-day EMA is flat and the RSI is just below the midpoint, which suggests a range formation for the next few days.
We now anticipate the bulls to carry the BSV/USD pair to the overhead resistance at $185.87. If the price turns down from this level, the pair will extend its stay inside the range for a few more days.
A break above $185.87 will indicate strength. Above this level, a move to the 50-day SMA at $223 and above it to $260 is possible.
On the other hand, if the bears sink the price below $146.96, a drop to $120 is likely. Therefore, the stop loss on the long positions can be kept at $146.
Hopefully, you have enjoyed today’s article. Thanks for reading!
Have a fantastic day!
Live from the Platinum Crypto Trading Floor.
Earnings Disclaimer: The information you’ll find in this article is for educational purpose only. We make no promise or guarantee of income or earnings. You have to do some work, use your best judgement and perform due diligence before using the information in this article. Your success is still up to you. Nothing in this article is intended to be professional, legal, financial and/or accounting advice. Always seek competent advice from professionals in these matters. If you break the city or other local laws, we will not be held liable for any damages you incur.
