Hi Crypto Network,
After Facebook, it is Apple, which has shown an interest in cryptocurrencies. Jennifer Bailey, vice president of Apple Pay, said that the company thinks that cryptocurrencies are interesting and have long-term potential.
Apple pay claims to process about one billion transactions a month, hence, Apple’s entry into cryptocurrencies will speed up adoption.
United States Securities and Exchange Commission Chairman Jay Clayton painted a mixed picture about Bitcoin exchange-traded funds (ETFs). He said that progress has been made but more work needs to be done before Bitcoin ETFs can become a reality.
Bitcoin’s dominance, that had risen above 71% in the past week is showing signs of cooling down. It has currently dropped below 70%. This implies that, for a few days, the action might shift to altcoins. However, this period of low volatility is unlikely to continue for long because after the Bakkt launch, both bulls and bears will attempt to establish their supremacy. This will result in increased volatility and a trending move.
An important event that can increase volatility in Bitcoin is the launch of Bitcoin futures platform Bakkt on September 23. This is expected to attract institutional investors with its Bitcoin settled futures products. So, should retail investors buy the leading digital currency at current levels or opt for the altcoins that are showing signs of life and can offer low-risk buying opportunities? Let’s analyse the charts.
BTC/USD
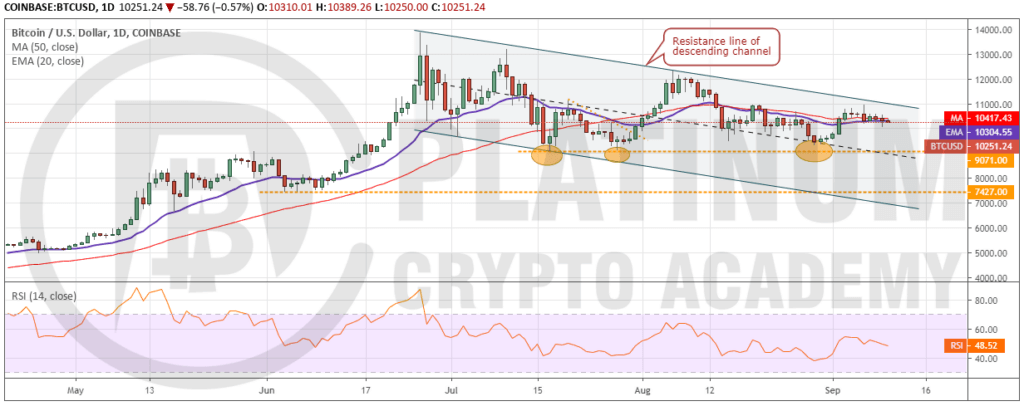
Bitcoin has been trading close to the moving averages for the past week. Both moving averages have flattened out and RSI is at the midpoint, which points to a balance between buyers and sellers. The volatility has dropped considerably in the past few days. This shows that both bulls and bears are playing it safe.
The balance will tilt in favour of bulls if the price breaks out and closes (UTC time) above $11,000. Therefore, we retain the buy recommendation given in an earlier analysis. Above $11,000, the cryptocurrency can rise to $13,868.44. If this level is scaled, momentum is likely to pick up and a rally to $17,178 is probable.
Conversely, if the price breaks down of the moving averages, it can slide to $9,071, which is an important support to watch out for. A break below this support will drag the price to $7,427.
ETH/USD
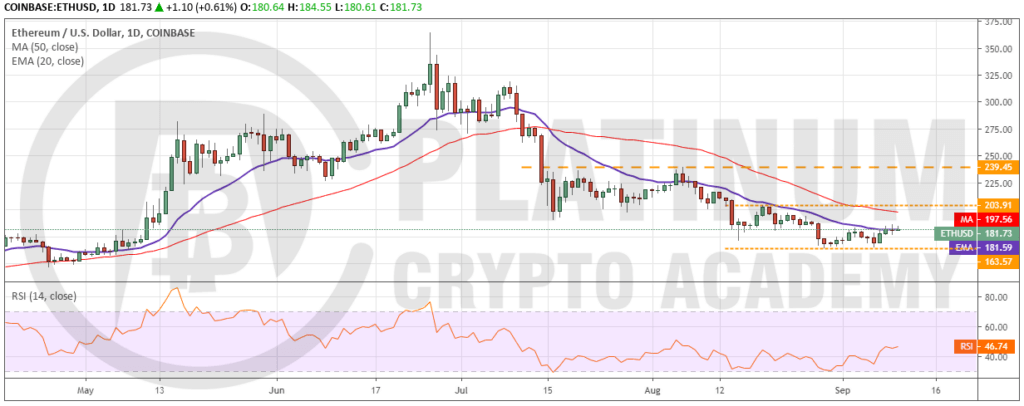
Ether has pulled back to 20-day EMA, above which a move to 50-day SMA is probable. A breakout of 20-day EMA will indicate a change in trend. Both moving averages have flattened out and RSI is just below 50, which points to a consolidation in the short-term.
The cryptocurrency might remain range-bound between $203.91 and $163.57 for the next few days. A breakout of this range will propel the price to $239.45. This is an important level, above which we expect the uptrend to resume.
Contrary to our assumption, if the cryptocurrency turns down either from 20-day EMA or 50-day SMA and plummets below $163.57, it will resume its down move that can extend to $150. We will wait for a new buy setup to form before proposing a trade in it.
XRP/USD
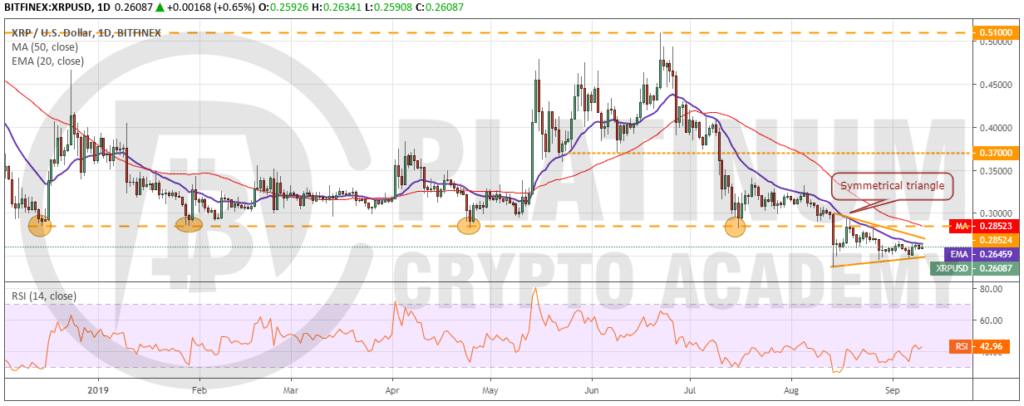
XRP is currently trading inside a symmetrical triangle. Usually, a symmetrical triangle acts as a continuation pattern but in some instances, it can even signal a trend reversal. If bulls push the price above the triangle, a move to 50-day SMA is likely. A breakout and close (UTC time) above the previous support turned resistance of $0.28524 will signal a change in trend. Therefore, traders can buy on a close (UTC time) above $0.28524 and keep a stop loss of $0.235. The first target on the upside is $0.37 and above it $0.51.
However, if the cryptocurrency turns down from $0.28524, it will remain range-bound between $0.28524-$0.2365 for a few more days. The trend will turn negative on a breakdown of the triangle. Below $0.2365, the decline can extend to $0.18.
BCH/USD
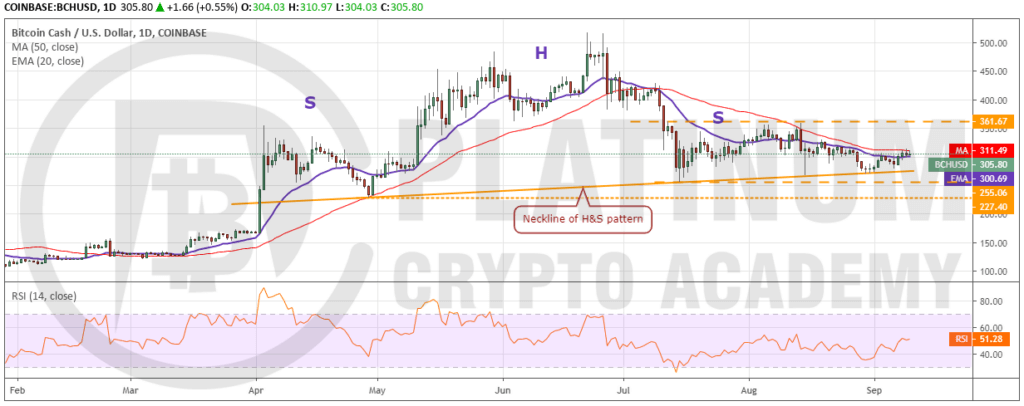
The bounce in Bitcoin Cash from the neckline of the head and shoulders (H&S) pattern is facing resistance at 50-day SMA. Both moving averages have flattened out and RSI is just above the midpoint, which points to consolidation.
A breakout of 50-day SMA can propel the price to $361.67. If the price turns down from this level, it will remain range-bound between the neckline and $361.67 for a few more days.
On the other hand, if bulls push the price above $361.67, a rally to $432.94 and above it to $517.75 is probable. We will watch the price action at $361.67 and then recommend a trade in it. Our view will be invalidated if bears sink the price below the neckline as it will complete the H&S pattern that can drag the price to $105.
LTC/USD
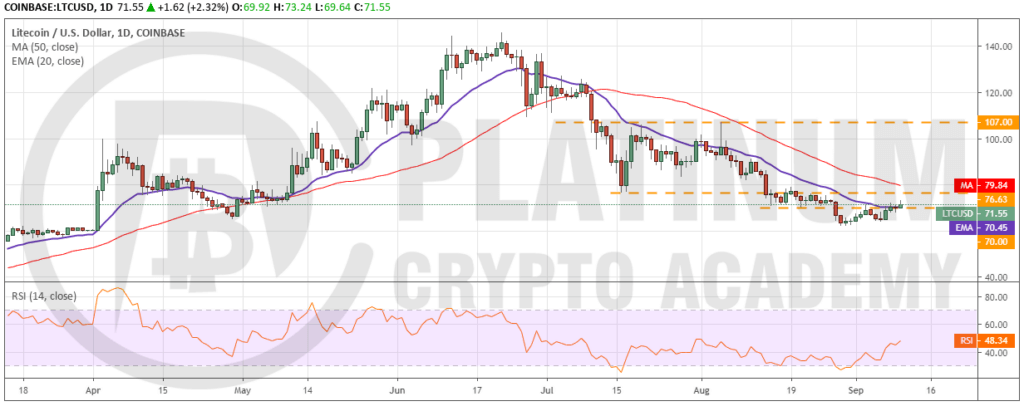
Litecoin is attempting a pullback. It has risen above 20-day EMA, which is a positive sign. This shows that bears are losing their grip. It can now move up to 50-day SMA, which is likely to act as a stiff resistance. A breakout of the 50-day SMA will be a positive sign and will signal a trend change. Therefore, traders can buy on a close (UTC time) above 50-day SMA and keep a stop loss of $62. The first target is $107, above which, the cryptocurrency is likely to pick up momentum.
However, if the price turns down from 50-day SMA, it will remain range-bound for a few more days. Our bullish view will be invalidated if the price plummets below $62. In such a case, a drop to $52 and below it to $42 is possible.
If you’ve booked your session above, we look forward to speaking to you soon!
Hopefully, you have enjoyed today’s article. Thanks for reading!
Have a fantastic day!
Live from the Platinum Crypto Trading Floor.
Earnings Disclaimer: The information you’ll find in this article is for educational purpose only. We make no promise or guarantee of income or earnings. You have to do some work, use your best judgement and perform due diligence before using the information in this article. Your success is still up to you. Nothing in this article is intended to be professional, legal, financial and/or accounting advice. Always seek competent advice from professionals in these matters. If you break the city or other local laws, we will not be held liable for any damages you incur.

