
Bitcoin rose 2.7% in April, extending its winning streak for the fourth straight month. Coinglass data shows that Bitcoin has risen for the first four months of the year only in 2023 and 2013. The big question is, could the gains continue? Bloomberg reported that four months of consecutive gains has in the past led to a sharp rally of 260% in Bitcoin over the subsequent year.
Although the long-term is bullish, concerns remain in the near term. The United States saw its third regional bank failure since March when JPMorgan Chase took over the ailing First Republic. While this has given some respite in the near term, Gary Cohn, former chief operating officer at Goldman Sachs, does not believe that the banking crisis has ended. While speaking to CNBC, Cohn said, “There will be other issues out there in the banking world.”
Many consider that the woes in the legacy banking system could increase investor interest in cryptocurrencies. However, if the banking crisis deepens, it is difficult to predict how Bitcoin will behave. There is a possibility that investors dump it considering it a risky asset and load up on safe haven assets.
Another near-term risk is the large supply of Bitcoin held by the government and Mt. Gox trustee. According to Glassnode data, both these entities hold a combined 343,404 Bitcoin. The movement of such large amounts of Bitcoin could depress the price in the near term. A false alert by blockchain analytics firm Arkham about the movement of coins from Mt. Gox and the US government wallets had caused Bitcoin to plunge about 7% in an hour on April 26.
Bitcoin and the altcoins may remain volatile ahead of the Federal Reserve’s monetary-policy decision on May 3. According to the FedWatch Tool, the probability of a 25 basis-point rate hike has risen to 94.5%. Any suggestion that more rate hikes are needed to curb inflation may pull risky assets lower while an indication of a pause in rate hikes may boost risky assets.
What are the support and resistance levels on Bitcoin and the major altcoins? Let’s study the charts to find out.
BTC/USD Market Analysis

Bitcoin bounced off the 50-day simple moving average (SMA) on April 26 and rose above the 20-day exponential moving average (EMA) on April 27. However, the bulls could not sustain the recovery as bears fiercely defended the $30,000 level.
That may have tempted short-term traders to book profits, which pulled the price below the 50-day SMA on May 1. The bears will try to strengthen their position further by sinking the price below the support at $27,000. If they succeed, the BTC/USD pair may plummet to the breakout level of $25,000.
Another possibility is that the price rebounds off $27,000. If that happens, the pair may oscillate between $27,000 and $30,000 for some time. The flattening 20-day EMA and the relative strength index (RSI) just below the midpoint suggest a range-bound action in the near term.
This view will be invalidated if the bulls drive the price above $30,000. That could open the doors for a potential rally to $32,400.
ETH/USD Market Analysis
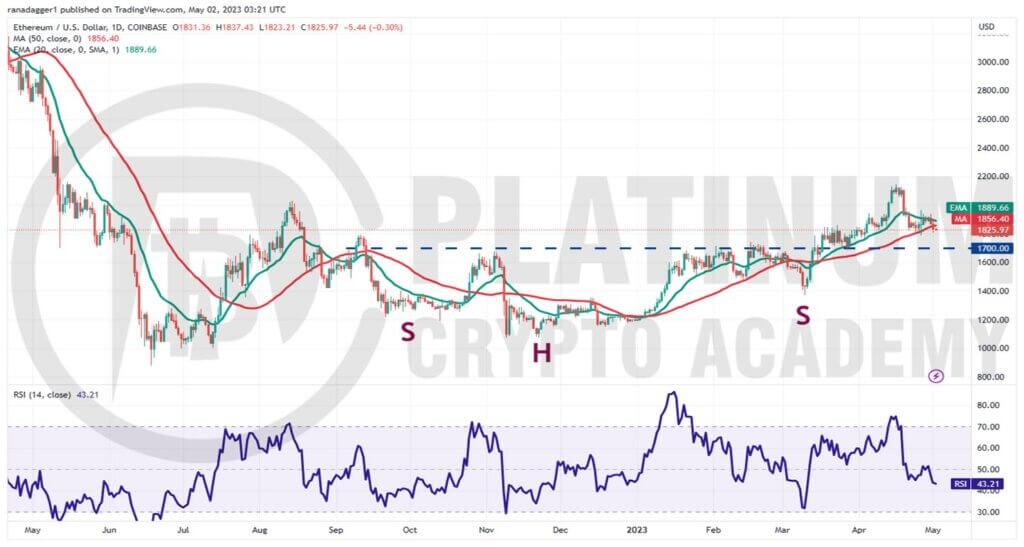
We said in the previous analysis that the bears are trying to flip the 20-day EMA into resistance and they did just that. The bears thwarted several attempts by the bulls to sustain Ether above the 20-day EMA last week.
We had also projected that the 50-day SMA support may break down and that happened on May 1. The 20-day EMA is sloping down gradually and the RSI is in the negative territory, indicating that bears have a slight edge.
There is a minor support at $1,785 but if bears sink the price below it, the decline could reach the crucial level of $1,700. The bulls are expected to aggressively defend this support.
Contrary to this assumption, if the price turns up from the current level and breaks above the 20-day EMA, it will suggest that the bears may be losing their grip.
The pair may first rise to $2,000 and then ascend to the stiff overhead resistance of $2,200.
BNB/USD Market Analysis
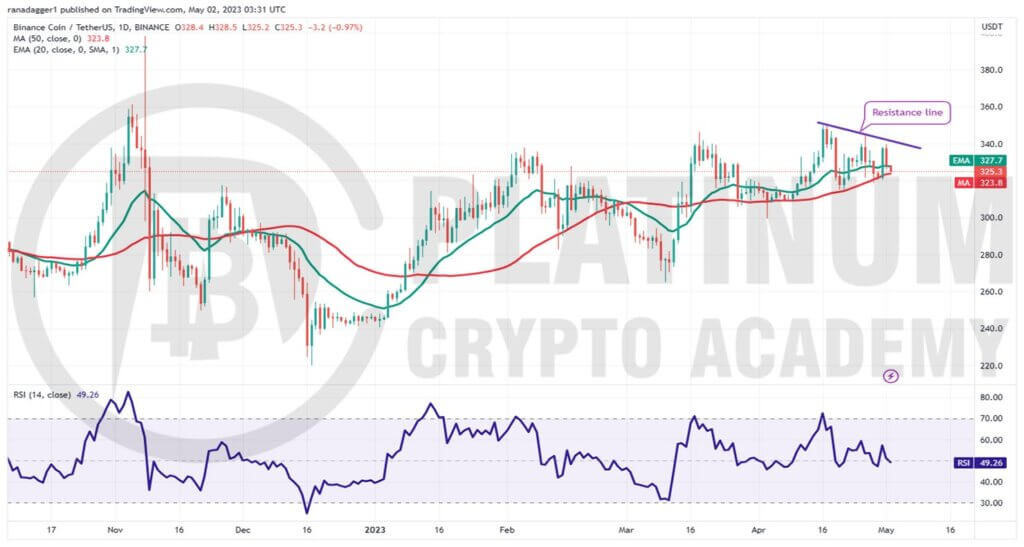
Binance Coin rose above $335 on April 25 but the bulls could not challenge the overhead resistance of $350. The price turned down from $345 on April 26 and slumped to the 50-day SMA on April 28.
The bulls are buying the dips to the 50-day SMA and the bears are selling near the resistance line. The flattening 20-day EMA And the RSI near the midpoint suggest a balance between supply and demand.
However, this tight-range trading is unlikely to continue for long. If the price rebounds off the current level and soars above the resistance line, it will suggest that the bulls have overpowered the bears. That could open the doors for a potential rally toward $400.
On the other hand, if the price falls below the 50-day SMA, it will suggest that the uncertainty of the tight range has resolved in favor of the bears. The BNB/USD pair may then dive to $300 and later to $280.
XRP/USD Market Analysis
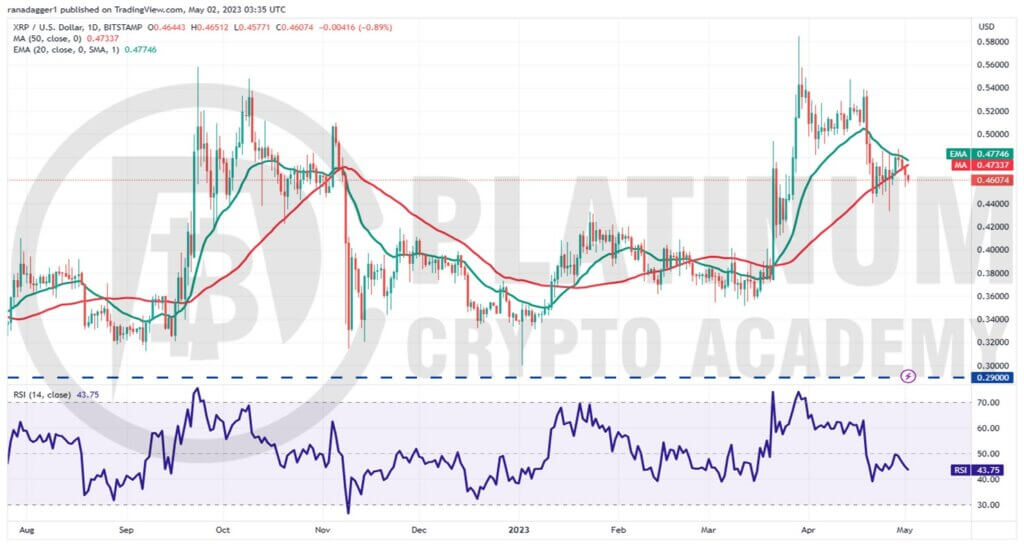
XRP broke below the immediate support at $0.44 on April 26 but the bulls aggressively purchased the dip as seen from the long tail on the day’s candlestick.
Buyers tried to propel the price above the 20-day EMA on April 29 but they could not sustain the higher levels as seen from the long wick on the day’s candlestick.
The moving averages are on the verge of a bearish crossover and the RSI has dipped below 44, indicating that bears have the upper hand.
The bears will try to yank the price below the critical support at $0.43. If they succeed, the selling could intensify and the XRP/USD pair may collapse to $0.40 and later to $0.36.
This bearish view will be invalidated in the near term if the price breaks and closes above the 20-day EMA. The pair may then surge toward $0.54.
ADA/USD Market Analysis
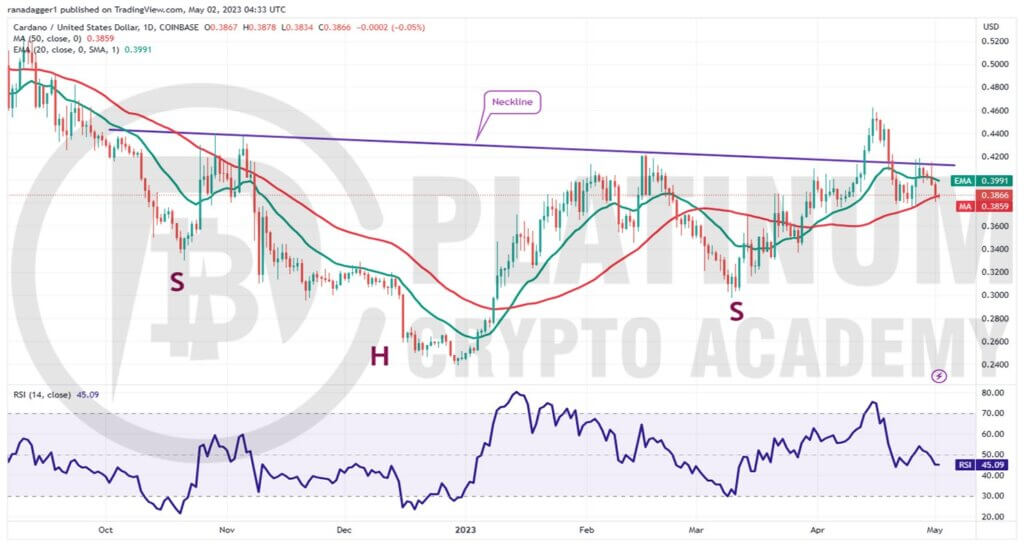
Cardano bounced off the 50-day SMA on April 26 but the bulls could not clear the overhead hurdle at the neckline of the inverse head and shoulders pattern. The price turned down and has reached the 50-day SMA where the bulls will try to arrest the decline.
The 20-day EMA has started to turn down and the RSI is just below the midpoint, indicating that the bears have a slight edge. If the 50-day SMA gives way, the ADA/USD pair could drop to $0.37.
This level may again act as a support but if it cracks, the selling could accelerate and the pair may descend to $0.33.
The neckline remains the key level to watch for on the upside. A break and close above it will suggest that bulls are back in the game. The pair may then climb to $0.46.
Hopefully, you have enjoyed today’s article for further coverage please check out our crypto Blog Page. Thanks for reading! Have a fantastic day! Live from the Platinum Crypto Trading Floor.
Earnings Disclaimer: The information you’ll find in this article is for educational purpose only. We make no promise or guarantee of income or earnings. You have to do some work, use your best judgement and perform due diligence before using the information in this article. Your success is still up to you. Nothing in this article is intended to be professional, legal, financial and/or accounting advice. Always seek competent advice from professionals in these matters. If you break the city or other local laws, we will not be held liable for any damages you incur.
